Common Graph Operations
This section describes functions that are common to panes that display graphs, such as Spectrum, Timechart, and Calibration Curve.
- Adjusting the scales
- Shifting the axes
- Expanding a selected area
- Exporting the graphs
- Copying the graphs
Adjusting the scales
The scales for the X- and Y-axes of the graph are optimized by default.
To adjust a scale, follow these steps:
- Move the cursor to the X or Y-axis.
The cursor changes shape to
 (for
the X-axis) or
(for
the X-axis) or  (for the Y-axis).
 - Right-click and drag the mouse.
The scale for the axis changes.
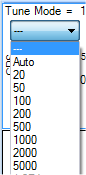
You can change the Y-axis scale in the Spectrum, Timechart, and Chromatogram (optional) panes by selecting a value out of the scale dropdown list.
To restore the X- and Y-axes to the default state,
click  on
the pane toolbar, or select [Auto Scale] from the context menu.
on
the pane toolbar, or select [Auto Scale] from the context menu.
The scroll wheel button returns to the default scale when clicked.
Shifting the axes
The X- and Y-axes of the graph can be transposed.
- Move the cursor towards the X or Y axis.
The cursor changes shape to
 (for
the X-axis) or
(for
the X-axis) or  (for the Y-axis).
 - Left-click and drag the mouse.
The axis shifts.
To restore the X- and Y-axes to the default state,
click on
the pane toolbar, or select [Auto Scale] from the context menu.
The scroll wheel button returns to the default scale when clicked.
Expanding a selected area
You can zoom in on a selected area of the graph.
Right-click and drag the mouse to draw a rectangular frame. When you release the mouse button, the area that is within the frame is expanded.
Expanding a selected area
To restore the expanded area to the default state,
click on
the pane toolbar, or select [Auto Scale] from the context menu.
The scroll wheel button returns to the default scale when clicked.
Exporting the graphs
You can export all of the graphics data for the selected pane, or export only the graphics at the cursor position. You can also specify the file format and the image size to export the graphics in.
To export the graphics, follow these steps:
- Right-click on the graphics to export.
The context menu is displayed.
- Select [Export Graphics].
The [Export Graphics] dialog box is displayed.
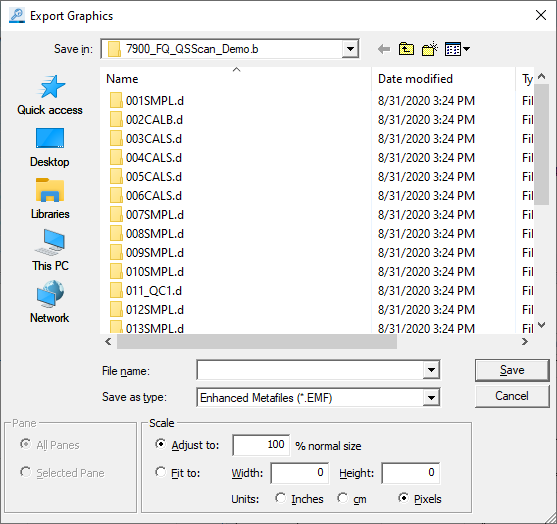
[Export Graphics] Dialog Box
- Select a folder to export to, and enter a file name.
- Select the export file type from the [Save as type] list. The following
file formats are available:
- Enhanced Metafiles (*.EMF)
- Bitmap Files (*.png, *.DIB, *.RLE)
- JPEG (*.JPG, *.JPEG, *.JPE, *.JFIF)
- GIF (*.GIF)
- TIFF (*.TIF, *.TIFF)
- PNG (*.PNG)
- In [Pane], select which panes you wish to export the graphics from.
- All Panes: Exports all graphics data for the selected pane.
- Selected Pane: Exports only the graphics at the cursor position.
- In [Scale], specify the image size.
- Adjust to: Resizes the graphics in %.
- Fit to:
Width: Specifies the width of the graphics.
Height: Specifies the height of the graphics.
- Units: Select the unit for the numeric values (Inches/cm/Pixels).
- Click <Save>.
The graphics from the selected pane are saved in the specified format and size.
Copying the graphs
Graphs can be copied to the Clipboard for use in documents that are created with other applications.
- Right-click on the graph to be copied.
The context menu is displayed.
- Select [Copy].
The graph is copied to the Clipboard.