Data Analysis Method Table Operation
The data analysis method table displays various tables for each method development task. This section describes the following operations in the Data Analysis method table:
Filling values and units
You can fill a column of cells with values and units, or change the entire column. To fill values, follow these steps. Use the same procedure to change the column in a single step.
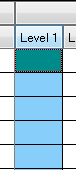
- Click the header for the column to be filled.
The entire column is selected and the first cell changes to green.
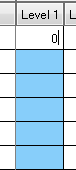
- Enter a value. To enter a unit, select the desired unit from the
drop down list.
The first cell is filled with a number or unit.
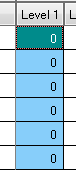
- Click the header, or press the Enter key.
All cells in the column will be filled with the value in the first cell.
When you change all the units in the column, the change is not made if the unit in the first cell is the same. In this case, select a different unit and change the column to that unit first. Then change the column to the desired unit.
Multiply the concentration of calibration curve levels
Use this procedure to fill or change all concentrations for a calibration curve level in a column. To automatically set the concentration, enter a multiplier for each calibration curve level.
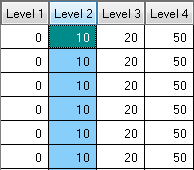
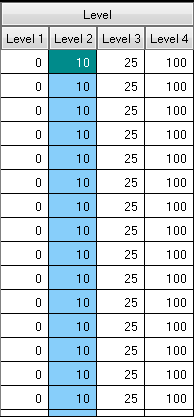
In this example, we change the concentrations for levels 1 to 4 from “0”, “10”, “20”, and “50” to “0”, “10”, “25”, and “100”.
- Click the header for the level column to use as the reference multiplier.
The entire column is selected.
Concentration levels that are set to “0” cannot be used as a reference.
To enter a new concentration or change the concentration of a reference level, first fill the column with values as described in “Filling values and units”.
- Right-click on the header for the level to be used as the reference,
and select [Multiply Conc] from the context menu.
The [Multiply Conc] dialog box appears.
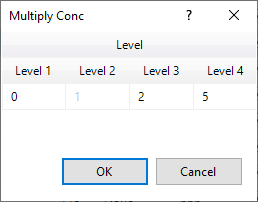
[Multiply Conc] Dialog Box
A “1” is displayed in the level to be used as the reference. The other levels contain the current multiplier.
- Double-click each level and enter the new multiplier.
In our example, the following values would be entered.
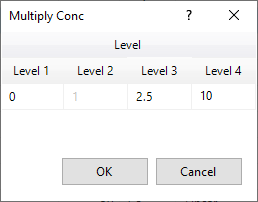
[Multiply Conc] Dialog Box
- Click <OK>.
The concentration for each calibration curve level changes.
Sorting
You can sort the method table by Tune Mode or Mass by using the headers. To sort the table, follow these steps:
- Click any column header with a arrow to the right of the header
label.
The method table will be sorted in ascending or descending order.
- Each time you click the column header, the sort order changes (ascending
or descending).
 :Descending order.
 :Ascending order.
 :Descending order.
 :Ascending order.
To display the table in the original sort order, select <Reset Sort> from the context menu.