Equations
Calibration
Weighted Regression
When data with more than one repetition is used to create a calibration curve, weighted regression can be selected. The count error for data collected in this manner is represented as the standard deviation of the counts. Usually the count error for higher concentrations is larger than that for lower concentrations. When using 1/SD^2 as the weight for the calibration curve table, lower concentrations are given more weight because it is more desirable that the curve pass through points having lower error than points having higher error.
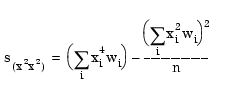
The weight of each point is calculated as follows.
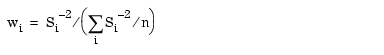
where
Si : standard deviation of each point
n : number of point
When using 1/x, 1/y, or 1/x^2 as the weight, si-2 in the above equation is replaced with 1/x, 1/y, or 1/x^2, respectively, to calculate the weight.
When using 1/x or 1/x^2 as the weight, the weight cannot be at a level where x may have a value of 0.
When using 1/y as the weight, the weight cannot be at a level where y may have a value of 0.
Only linear regressions can be weighted.
Internal Standard
When an internal standard is selected, the count of each data point in the calibration curve is divided by the ratio of the count per concentration of the internal standard of the same level.
When yys /(yi/xi)(xi=0, y=ys)
where
xi : concentration of internal standard
yi : count of internal standard
ys : count of sample data
This value is used as the measured value of y in the following sections.
Correlation Coefficient
This value is calculated using the following formula.
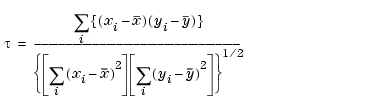
where
![]() : average of xi
: average of xi![]() : average of yixi : measured value of x
: average of yixi : measured value of x
yi : measured value of y
This is available only for linear regressions.
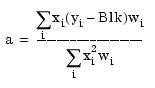
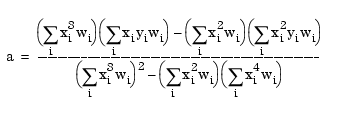
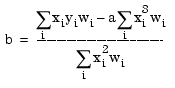
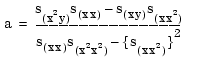
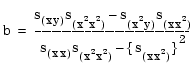
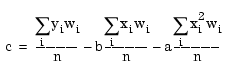
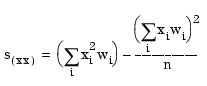
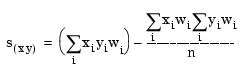
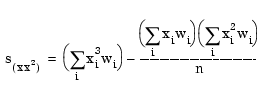
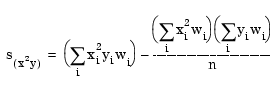
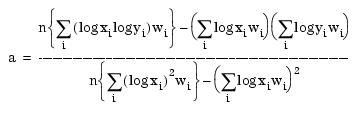
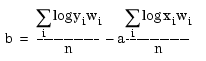
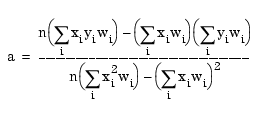
Coefficients of Calibration Curves
Coefficients are calculated as follows.
where
n : number of points
xi : numbered value of x
yi : measured value of y
wi: weight of each point (wi=1.0 in the case of unweighted regressions)
- y = ax
- y = ax + b
- y = ax2 + bx
- y = ax2 + bx + c
- log (y) = a (log x) + b
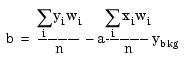
- y = ax + b + bkg (Standard Addition)
- y = ax + [blank]
where
Blk: number of counts in the calibration blank

![]()

where
where
ybkg: count of the background
% Relative Error (%RE)
% Relative Error (%RE) is calculated as,
![]()
Where, ![]() is true value
for the calibration standard, and
is true value
for the calibration standard, and ![]() is
measured concentration of the calibration standard.
is
measured concentration of the calibration standard.
If ![]() is 0 (i.e. blank), this
value cannot be calculated. In that case, the value will be empty.
is 0 (i.e. blank), this
value cannot be calculated. In that case, the value will be empty.
% Relative Error (%RE) is displayed in the Calibration Curve table for Data Analysis software.
Relative Standard Error (%RSE)
Relative standard error% represents a metric for calibration curve fitting. The value is calculated as,

Where ![]() is the true
value for the calibration level
is the true
value for the calibration level ![]() ,
, ![]() is
the measured concentration of the calibration level
is
the measured concentration of the calibration level ![]() ,
, ![]() is the number of terms in
the fitting equation (Average of Response Factor=1, Linear=2, Quadratic=3),
and
is the number of terms in
the fitting equation (Average of Response Factor=1, Linear=2, Quadratic=3),
and ![]() is the number of
available calibration points. If
is the number of
available calibration points. If ![]() is
0 (i.e. blank), the level is not used. This means the level is skipped
from the above equation. For example, even if there are 4 levels for calibration
curve and if one level is used for blank (the expected concentration is
0), the other 3 levels will be used for the calculation.
is
0 (i.e. blank), the level is not used. This means the level is skipped
from the above equation. For example, even if there are 4 levels for calibration
curve and if one level is used for blank (the expected concentration is
0), the other 3 levels will be used for the calculation.
% Relative Standard Error (%RSE) is displayed in the Calibration Curve table and Batch table for Data Analysis software.