Standard Solutions
Preparation of Standard Solutions
Although standard solutions can be prepared from commercially available materials, many prepared standard solutions are also available from reagent manufacturers. Standard solutions for atomic absorption are inexpensive and can be reserved longer. Besides, you can mix them for your purpose. Recently, solutions that contain several elements and can be used for simultaneous multi-element analysis are available. These solutions improve the efficiency in analysis and avoid incorrect mixture and problems that may occur due to the chemical properties of solutions in a mixing process. Note however that because of the restrictions on the combination of elements, since the concentration of a mixed standard solution may be controlled to a lower level, be aware of the remaining amount and retention period of the standard solution.
Even if it is within the warranty period specified by the manufacturer, if the amount of a mixed standard solution is about 10 ppm and the retention method is not appropriate, the concentration may be changed. In particular, adsorptive elements such as Hg should be used with caution. We recommend you keep standard solutions of the same element from more than two companies and sometimes you should quantitate those standard solutions to check if a difference in concentration occurs among them.
When you prepare a mixed standard solution from some solutions, check the contents of each solution. When counterion elements are contained in the target elements or when a element react with other elements or counterions, prepare separate standard solutions. For example, potassium chromate is often used in the preparation of a Cr standard solution. In this case, the concentration of K can be different from the intended level. Also, sodium silicate may be used in the preparation of a Si standard solution, but should not be mixed with a Na standard solution. The standard solution of some elements may be alkali or may contain hydrofluoric acid. An oxidation-reduction reaction may occur when the two solutions are mixed. Then the form of the substance may change to a different form that is adsorptive to the container surface or a precipitation may be form due to a low solubility product of the substance and its counterion.
Note however that if the concentration is low enough, the reaction is not likely to occur and it may be okay to mix the two solutions. If you can prepare a single solution, you can reduce the analysis time. If it is difficult to determine which is better, create a calibration curve or compare the sensitivities between the single and separated standard solutions.
Standard Solution
In general, the error in the calibration curve produced by the least squares method is lowest in the higher concentration range. Therefore, a calibration curve should be made for a concentration range that covers the concentration of the sample. However, the ICP-MSICP-QQQ has a wide linear dynamic range in practice and quantitative results can be obtained with comparatively little error at down to one tenth the maximum concentration level of the calibration curve.
In contrast, the error is large for quantitative analysis at lower concentrations when the range of the calibration curve includes several high concentration levels: points at the high end of the range may significantly shift the line of best fit if the least squares method is used directly, and the error in these points may affect the entire range (see below). In this case, the weighted least squares method should be used to weight the standard deviation of each point that gives more weight to points with a low standard deviation. For example, accurate quantitative analysis cannot be achieved for 1 ppb samples if the calibration curve is produced from levels of 0, 50 and 100 ppb. For such samples, use a calibration curve with a maximum concentration of about 10 ppb.
When the concentrations of analytes in samples vary through a wide range, calibration curves should include several points such as 0, 0.1, 1, 10 and 100 ppb, and selecting adequate calibration points for each sample improves the accuracy of quantitative calculations.
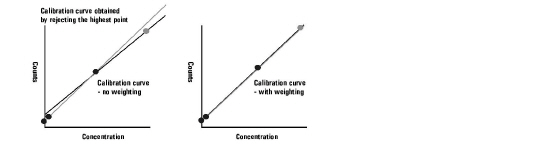
Weighted and unweighted calibration curves