Analysis performance terms
Limit of Detection
Limit of detection (LOD) is normally calculated from three times the standard deviation (s) of the blank water signal counts, divided by the sensitivity factor based on analysis of a standard solution. Sensitivity means counts per unit conc entration.
![]()
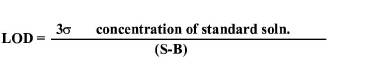
s: standard deviation in counts of a blank solution
S: counts of a 10 ppb solution
B: counts of the blank background
According to statistics, 7 repetitions are required to achieve the 95% confidence level.
In order to understand the relationship between the LOD and the integration time, the following example is used to illustrate this idea:
When counts are not high, the standard deviation (s) is roughly equal to the square root of the signal of the blank. Assume that the sensitivity is 10,000 cps for 1 ppb, and the background is 5 cps. When the integration time is 10 seconds, the signal for a 1 ppb solution and the background will be 100,000 counts and 50 counts, respectively. The standard deviation will be the square root of 50 counts, which is 7.07. Then, the LOD is 0.21 ppt.
When the integration time is 1 second, the signal for a 1 ppb solution and the background will be 10,000 counts and 5 counts, respectively. The s.d. will be 2.236, and the LOD will be 0.67 ppt.
When the integration time is 0.1 seconds, the signal for 1 ppb solution and the background will be 1,000 counts and 0.5 counts, respectively. The s.d. will be 0.707, and the LOD will be 2.1 ppt.
From these calculations, the LOD will be improved by the square root of the integration time, and 10 seconds is an acceptable integration time to get best LODs Even if 100 seconds integration time is used, the LOD will be improved only by about a factor of three times. This is why 10 seconds integration time is commonly used for calculating best LODs.
It has to be noted that at least 1,000 counts will be required to get reproducible data: the S.D. will be 33 counts that will be 3.3 % RSD. 10,000 counts will be required to achieve a precision of ~1% RSD on the signal.
The detector will be switched from pulse counting mode to analog mode at around 1,300,000900,000 cps. The maximum count rate of the EM in analog mode is about 4,000,000,00010,000,000,000 cps.
For real detection limit calculations, sometimes called the quantitative detection limit, 10 s is often used instead of 3 s.
Precision
The precision of ICP-MSICP-QQQ is commonly expressed by repeatability of isotope ratio measurements.
To analyze isotope ratios, a 10 ppb Ag standard solution is commonly used because Ag has two isotopes that have almost the same isotopic abundance, at masses 107 and 109. The precision is expressed by the RSD of isotope ratio measurements with 10 repetitions. Typical RSDs are better than 0.2 %, about 0.18 - 0.15% with 30 seconds integration time per mass and three points per mass.
To get good precision, the important factor is stability of the signal: RSDs in the tuning mode should be as low as possible. The shorter the signal acquisition interval is, the more signal instability is cancelled out, and therefore, set [Sweeps/Replicate] to 10,000 times on the Setup Pane. When the integration time per point is 1 second, the integration time in the spectrum mode is 10 msec and that of the isotope ratio analysis mode is 1 msec.
To get best precision, self-aspiration with the MCN is a good choice to achieve better RSD.
Accuracy
Accuracy may be determined by analyzing reference materials with certified values and comparing the analytical results to the certified values. Keep in mind that accuracy depends not only on instrument performance but also on the laboratory techniques of the analyst. There are several analytical laboratory techniques, can affect accuracy. Accurately preparing calibration standards involves the use of grade A volumetric flasks and pipettes which have been verified for accuracy of delivery. The correct technique in using the flasks and pipettes is also important. Clean flasks and pipettes in a manner that are appropriate to the analysis and keep them in a clean environment after cleaning. Otherwise use flasks and pipettes that are clean and free from impurities when purchased from the vendor.
Calibration standards should have analyte concentrations that are made from certified standard reference materials, which have low impurity levels. Store these calibration standards in a manner and environment that preserves their original concentration for as long a period as they are certified to be accurate. Keep in mind that chemical incompatibilities between elements in solution may cause precipitation of the elements. The matrix of stock solutions may also cause other elements in multielement solutions to precipitate.
Configuring and using the instrument properly for analysis, such as selecting tuning conditions that are appropriate to the analysis, improves performance and accuracy. Refer to the sections on tuning for more information. Making a good standard calibration curve from which to quantitate the data is essential. Both the slope of the response and the y-intercept at zero concentration of the calibration curve must be accurate. Calibration curves with more than two levels for each element depend on the accuracy of each level for the r value of the curve to be good. The r value is an expression of the linearity of all the points on the curve.
In order for the least squares determination of the r value to be statistically valid, the calibration points should be evenly spaced with respect to their concentrations. Sometimes various curve fitting techniques other than simple linear curves are used to compensate for calibration points that are not linear with respect to the calibration curve. If this is necessary then the accuracy of the calibration curve (its slope or y-intercept) may not be good.
Quantitative sample preparation, that is, techniques that promote complete recovery of the analytes from the sample and avoid contamination of the prepared samples, are also important for accuracy. Follow a quality control protocol for your analysis to monitor the accuracy of the data while it is being obtained.
The issues described above, which affect the accuracy of the analysis results, are determined by the technique of the analyst and not by the performance of the instrument.