Spectrum pane
This section describes the functions of the commands that are available in the Spectrum pane.
For more detailed operations, refer to "Spectrum Pane Operation".
- Title Bar
- Spectrum/Chromatogram Toolbar
- Functions (Spectrum/Chromatogram) Toolbar
- Zoom Toolbar
- Scale Dropdown List
- Context Menu
- Spectrum Assistant Table
- To Get Here
Title Bar
The title bar buttons and the context menu have the same functions as the Title Bar of the Instrument Status Pane.
Spectrum/Chromatogram Toolbar


 Drag to move the toolbar.
 Displays
the graph for the previous sample.
Displays
the graph for the previous sample.
 Displays the graph for the next
sample.
Displays the graph for the next
sample.
 Displays
the graph for the previous element.
Displays
the graph for the previous element.
 Displays the graph for the next
element.
Displays the graph for the next
element.
 Displays
or hides the ISTD Stability Graph.
Displays
or hides the ISTD Stability Graph.
 Displays
or hides the QC Sample Stability Graph.
Displays
or hides the QC Sample Stability Graph.
 Displays or hides the Spectrum/Chromatogram.
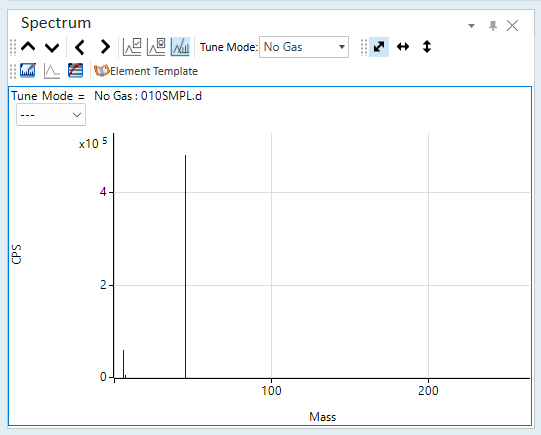
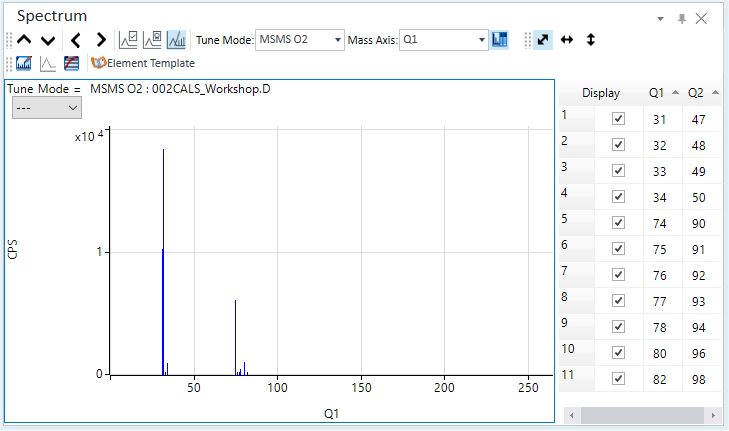
Displays the Spectrum
for the selected Tune Mode.
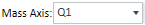 Sets the
mode for Mass Axis.
Sets the
mode for Mass Axis.
[Mass Pair]: Displays the masses of Q1 and Q2 on the Spectrum Assistant table.
[Q1]: Displays the masses of Q1 on the Spectrum Assistant table.
[Q2]: Displays the masses of Q2 on the Spectrum Assistant table.
 Displays
or hides the Spectrum Assistant table.
Displays
or hides the Spectrum Assistant table.
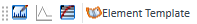
Functions (Spectrum/Chromatogram) Toolbar
![]() Opens the [Change
Spectrum] dialog box, which lets you view the spectra for multiple
data.
Opens the [Change
Spectrum] dialog box, which lets you view the spectra for multiple
data.
 Overlays multiple graphs.
![]() Changes between log
scale and linear scale.
Changes between log
scale and linear scale.
 When
this is on, element templates for all elements are displayed on the spectrum.
This lets you identify elements and determine if the spectrum was created
by polyatomic ions.
When
this is on, element templates for all elements are displayed on the spectrum.
This lets you identify elements and determine if the spectrum was created
by polyatomic ions.
Zoom Toolbar

 Automatically adjusts the scale
for the X-axis and the Y-axis.
Automatically adjusts the scale
for the X-axis and the Y-axis.
 Automatically
adjusts the scale for the X-axis.
Automatically
adjusts the scale for the X-axis.
 Automatically
adjusts the scale for the Y-axis.
Automatically
adjusts the scale for the Y-axis.
Scale Dropdown List
Lets you set the scale of the Y-axis.
Context Menu
This section describes the commands that are available in the context menu, which is displayed when you right-click in the pane. The commands that are not listed below have the same function as their counterparts on the toolbars and the Ribbon.
[Count Display Mode]
Displays or hides the tooltip display for the Count value.
[Annotate]
[Add/Remove Annotation]
Opens the [Add comment] dialog box where you can add comments to the graph. To clear a comment, click this icon, and then click the comment on the graph.
[Save Annotation in Data]
Click this item to save the contents of annotations in a batch after you have written annotations.
[Three Tiers]
Changes the horizontal scale (1 row or 3 rows) for the Spectrum.
[Line Display]
Displays or hides the spectra with their peaks connected.
[Count/CPS]
Changes between Count view and CPS view.
[Element Template]
[Select Element for Template]
Displays or hides the isotope information for the region near the selected mass. Click the peak to open the [Ion Database] dialog box where you can view the isotope information for elements near the selected mass.
[Sum Peaks]
Displays the summed template when multiple templates are overlaid for a particular mass.
[Subtract Spectrum]
Performs Spectrum subtraction. Select the data to be subtracted in the [Please select data to subtract] dialog box.
[Tabulate Spectrum]
[Average Spectrum/Point]
Displays the average for each point.
[Average Spectrum/Mass]
Displays the average for each mass.
[Replicate Spectrum/Point]
Displays the replicate data for each point.
[Replicate Spectrum/Mass]
Displays the replicate data for each mass.
[Copy]
Copies the selected data to the Clipboard. When a graphics pane is selected, the graphics are copied.
[Page Setup]
Opens the [Page Setup] dialog box where you can configure the page settings for printing.
[Print]
Opens the [Print] dialog box where you can print the contents of the selected pane.
[Print Preview]
Opens the [Print Preview] dialog box where you can display the print preview.
[Export Graphics]
Opens the [Export Graphics] dialog box where you can export graphics data. This command is available when a pane that includes graphics is selected.
Spectrum Assistant Table
[Display] column
Displays only the peaks of the selected masses in the Spectrum pane.
[Q1] column
Displays the masses of Q1.
[Q2] column
Displays the masses of Q2.
To Get Here
- Opens the batch result on [ICP-MSICP-QQQ Data Analysis] window.
- Select [Panes] - [Spectrum/Timechart] from the [Show] group in the [View] tab in the [ICP-MSICP-QQQ Data Analysis] window.