Spectrum Pane Operation
This section explains the operation of the Spectrum pane. For details of functions common to all panes, refer to “Common Pane Operations”.
Spectrum Pane
Displaying the Spectrum
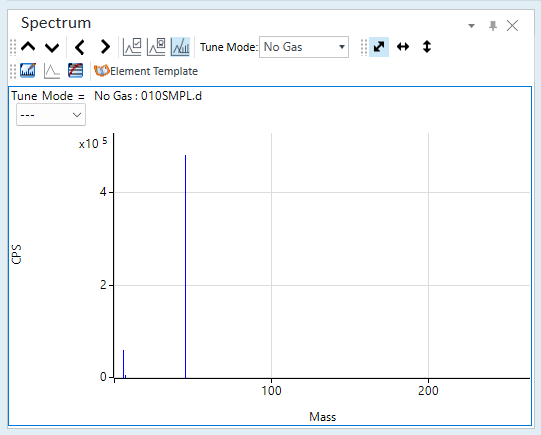
The Spectrum pane is displayed when you load data for which the Analysis Mode is set to “Spectrum”. The mass spectrum for the sample that is selected in the Batch Table is displayed in the Spectrum pane. The X-axis represents the mass, and the Y-axis represents the count or the CPS.
To display data for a different sample in the Spectrum pane, click one of the following icons on the Spectrum pane toolbar.
 Displays
the spectrum for the previous sample.
Displays
the spectrum for the previous sample.
 Displays the spectrum for the next
sample.
Displays the spectrum for the next
sample.
If the Spectrum
pane is not shown, click [Panes] from the [Show] group on the
[View] tab. Also make sure that  on
the toolbar is inverted. If the is
not inverted, click it.
on
the toolbar is inverted. If the is
not inverted, click it.
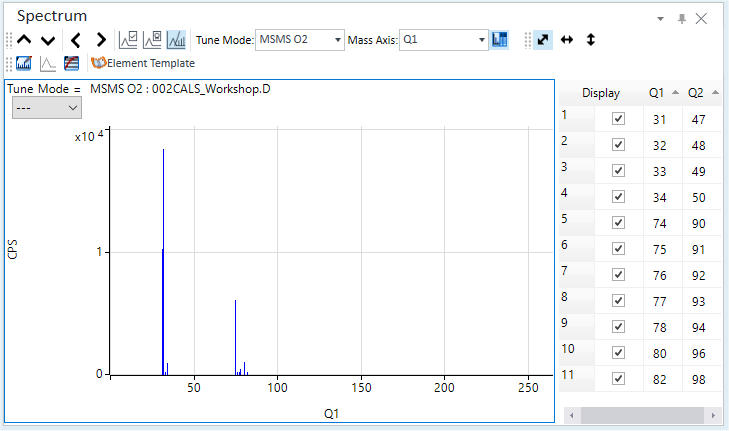
Spectrum Assistant table
Only the peaks of the masses selected in the [Display] column are displayed in the Spectrum pane.
Toolbar Functions
For the functions of the toolbar, refer to “Spectrum pane” help topic.
Adjusting the scales
The scale for the X- and Y-axes can be changed. For more information, refer to “Adjusting the scales” under “Common Graph Operations”.
Shifting the axes
The X- and Y-axes can be transposed. For more information, refer to “Shifting the axes” under “Common Graph Operations”.
Expanding a selected area
You can zoom in on a selected area of the spectrum. For more information, refer to “Expanding a selected area” under “Common Graph Operations”.
Changing the display type
You can change the spectrum display type by clicking the context menu.
[Count Display Mode]: Displays or hides the tooltips for the Count value
[Three Tiers]: Changes the horizontal scale (one row or three rows).
[Line Display]: Displays or hides spectra with connected peaks.
[Log]: Selects either the log scale or linear scale.
[Count/CPS]: Select either Count view or CPS view.
Adding comments
Comments can be added to the spectra.
Adding a comment
To add a comment, follow these steps:
- Right-click on the Spectrum pane and select [Annotate] - [Add/Remove
Annotation] from the context menu.
The icon is inverted, and the cursor changes to
 .
. - Click at the location where you wish to add the comment.
The [Add comment] dialog box is displayed.
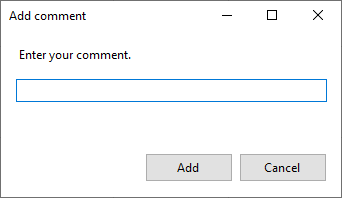
[Add comment] Dialog Box
- Enter the text to be added.
- Click <Add>.
The text string is added at the specified point on the spectrum.
- When finished, select [Annotate] - [Add/Remove Annotation] again from the context menu.
To save an annotation in the batch, select the [Annotate] - [Save Annotation in Data] from the context menu.
Deleting comments
To delete existing comments, follow these steps:
- Right-click on the Spectrum pane and select [Annotate] - [Add/Remove
Annotation] from the context menu.
The icon is inverted, and the cursor changes to
 .
. - Move the cursor towards the comment to be deleted. When the cursor
changes to
 , click the mouse.
The comment is deleted.
- When finished, select [Annotate] - [Add/Remove Annotation] again from the context menu.
Displaying the template
The information that is stored in the element database can be used as a template for matching spectra. This lets you identify elements and determine if the spectrum was created by polyatomic ions.
- Displaying templates for all elements
- Displaying the element database and the template
- Deleting templates
Displaying templates for all elements
If you click  on the toolbar to turn it on, element templates for all elements are displayed
on the spectrum.
on the toolbar to turn it on, element templates for all elements are displayed
on the spectrum.
To clear the element templates, click to turn
it off.
Displaying the element database and the template
- Right-click on the Spectrum pane and select [Element Template]
- [Select Element for Template].
The icon is inverted, and the cursor changes to
 .
. - Move the cursor towards the peak to be checked. When the cursor
changes to
 , click the mouse.
The [Ion Database] dialog box appears. If you click the [Template] button, the isotope information for the elements near the selected mass is displayed.
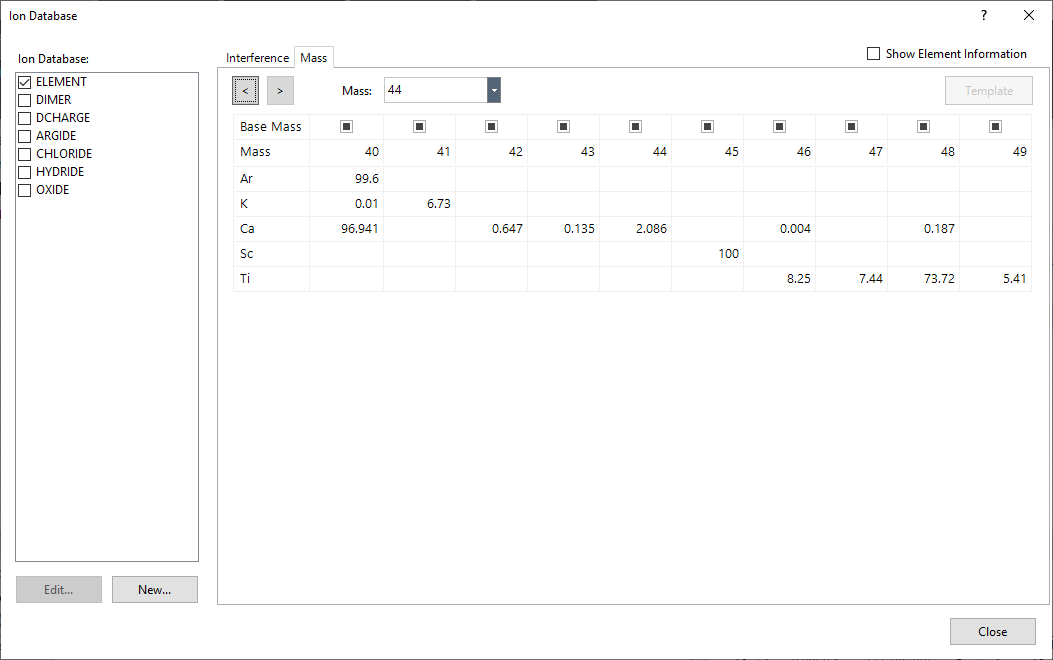
[Ion Database] Dialog Box
The selected mass is shown in red.
- To use polyatomic ion databases other than the element database (Element.db), select the desired database.
- Click the element for which to display the template.
Select the element for which isotopes exist at the selected mass. If multiple isotopes exist, select the mass to use as the base for creating the template.
- Click the [Template] button.
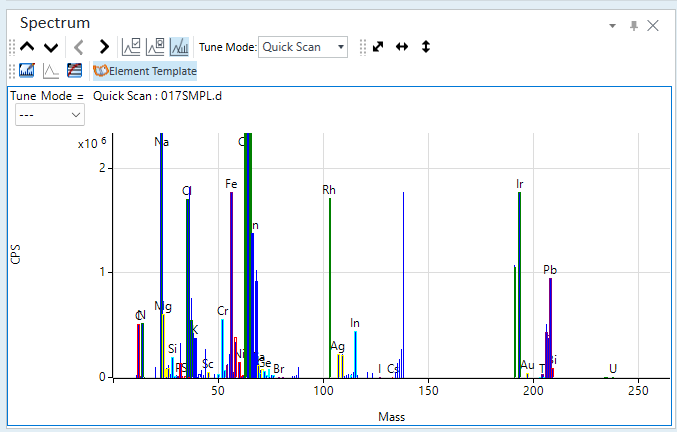
The template is overlaid on the spectrum. The template is normalized based on the signal strength of the base mass.
Template Display
- To use multiple templates, repeat steps 2 through 4 above.
The templates are shown in a different color for each element, and are labeled with the element name above the base mass.
- When finished, select [Element Template] - [Select Element for Template] again from the context menu.
If multiple templates overlap on a single mass, select [Element Template] - [Sum Peaks] from the context menu to display the summed template.
Deleting templates
- Right-click on the Spectrum pane and select [Element Template]
- [Select Element for Template].
The icon is inverted, and the cursor changes to
 .
. - Move the cursor towards the template to be deleted. When the cursor
changes to
 , click the mouse.
A confirmation message is displayed.
- Click <OK>.
The template is deleted.
- When finished, select [Element Template] - [Select Element for Template] again from the context menu.
Subtracting background spectra
Background subtraction is used to subtract the background spectrum from the sample spectrum. It is not to be confused with blank subtraction, which subtracts concentration data during a quantitative analysis.
To subtract the background spectrum from a sample spectrum, follow these steps:
When using ECM, OpenLab Server Products, Workstation Plus, or SDA, the displayed dialog box and the save file destination differ from standard MassHunter operations. For more information, refer to " Operations When Database Systems Are Used" in "Reference".
- Right-click on the Spectrum pane and select [Subtract Spectrum]
from the context menu.
The [Please select data to subtract] dialog box is displayed.
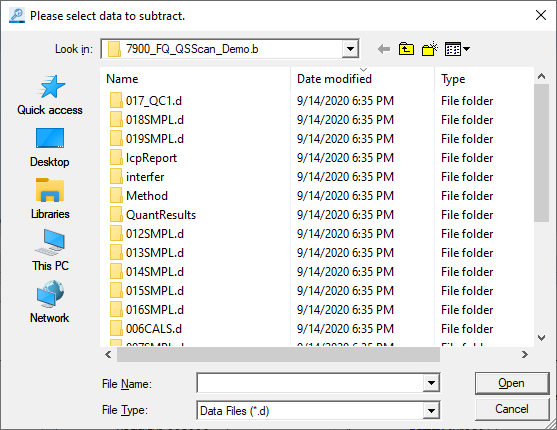
[Please select data to subtract.] Dialog Box
- Select the background data and click <Open>.
The spectrum is displayed with the background subtracted.
Displaying multiple spectra
In the Spectrum pane, a spectrum for the average values will be shown for replicated analyses, and a single Tune Mode spectrum will be shown for Multi Tune. You can display multiple spectra in the pane.
To display multiple spectra, follow these steps:
- Click the
 icon on the toolbar.
The [Change Spectrum] dialog box is displayed.
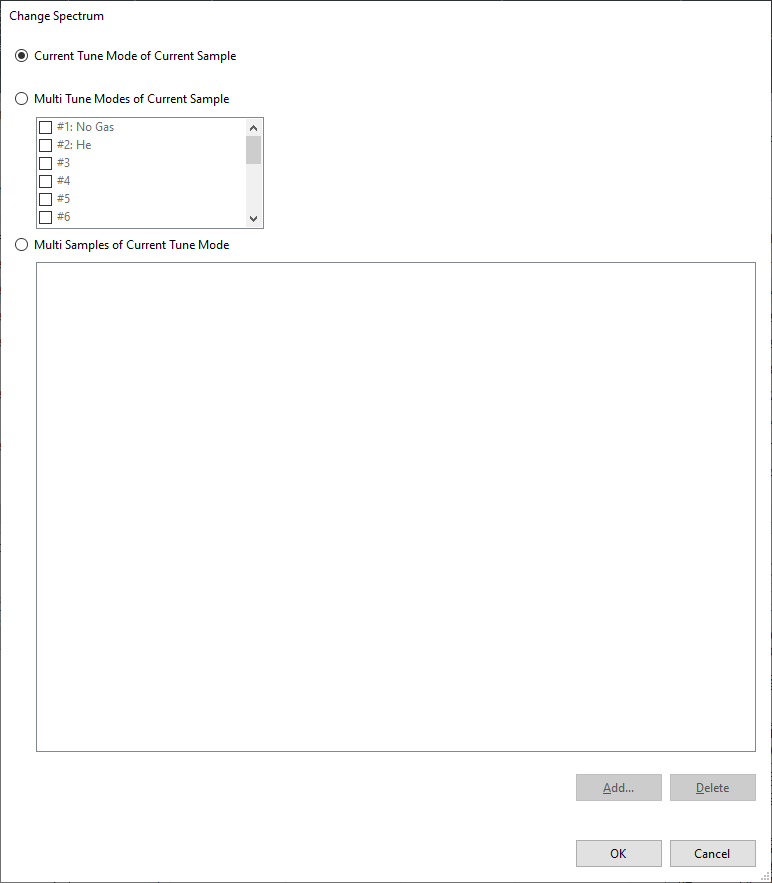
[Change Spectrum] Dialog Box
- Set the display setting for the spectra to one of the following:
- For the current sample, show the spectrum for the current Tune Mode (default)
- For the current sample, show the spectra for multiple Tune
Modes
Select [Multi Tune Modes of Current Sample], then select the Tune Modes to display.
- For the current Tune Mode, show the spectrum for the analyses.
Select [Multi Samples of Current Tune Mode]. Select the data in the dialog box that is displayed, then click <Add>.
- When done, click <OK>.
The spectra are displayed in different parts of the pane.
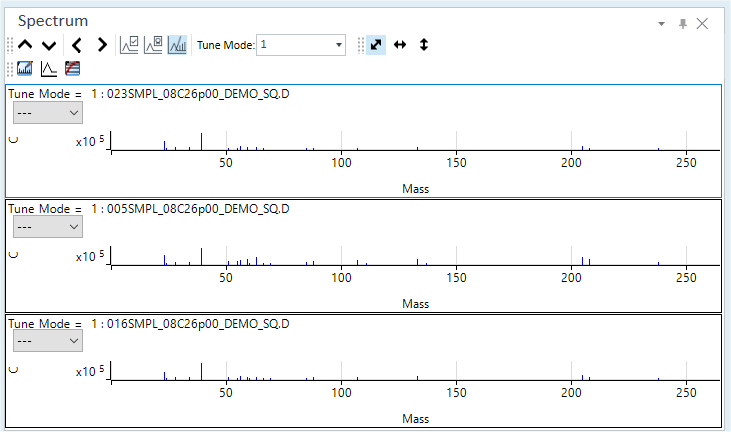
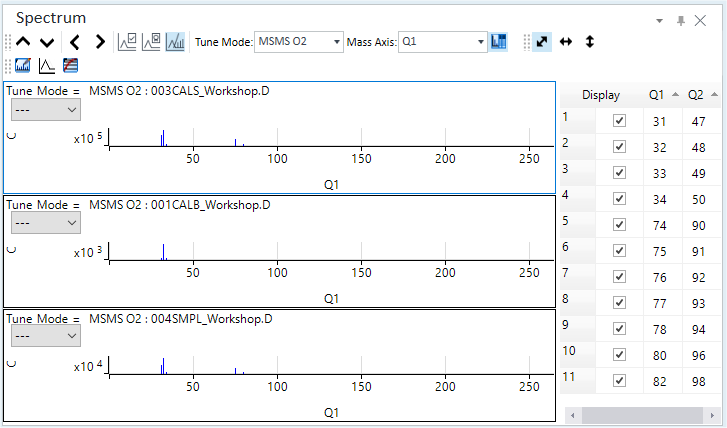
Displaying Multiple Spectra
Overlaying multiple spectra
Multiple spectra that are displayed in the split Spectrum pane can be displayed as a single overlaid spectrum.
- With the spectra displayed in the split pane, click the
 icon on the toolbar.
The spectra become overlaid.
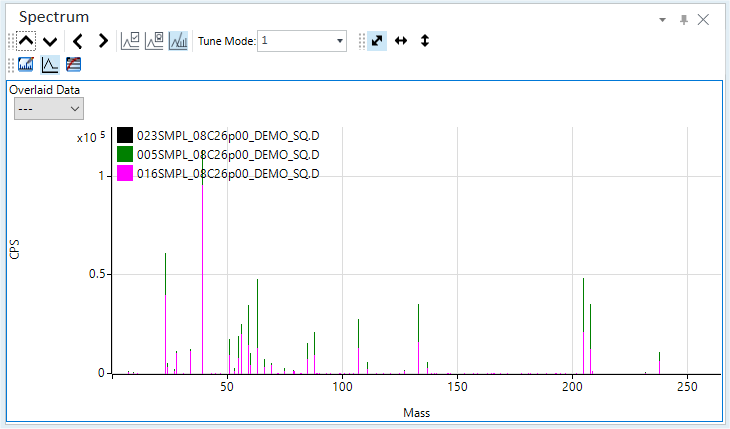
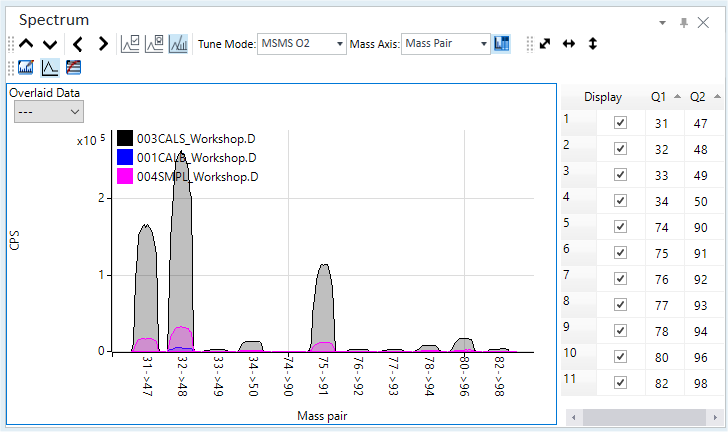
Overlaying Spectra
Resetting the display of multiple spectra
To reset the split panes or the overlaid spectra to the original state, follow these steps:
- Click the
 icon on the toolbar.
The [Change Spectrum] dialog box is displayed.
- Select [Current Tune Mode of Current Sample] and click <OK>.
The original view is restored.
Averages and tabulating individual data
A table can be created based on the averages from replicate analyses or individual data.
The table will list the header information, mass, element name, CPS, repetition count, SD, RSD (relative standard deviation %), integration time, and other data for each Tune Mode.
The created table can be edited and graphed in the associated application.
- Right-click in the Spectrum
pane.
The context menu is displayed.
- Select [Tabulate Spectrum], and select one of the following commands
from the submenu.
- [Average Spectrum / Point]: Displays a table for the average data for each point.
- [Average Spectrum / Mass]: Displays a table for the average data for each mass.
- [Replicate Spectrum / Point]: Displays a table for the replicated data for each point.
- [Replicate Spectrum / Mass]: Displays a table for the replicated data for each mass.
- The replicated average or the individual data is displayed in the
associated application.
Averages File (when using the Excel)
- Close the application.
The application returns to the [ICP-MSICP-QQQ Data Analysis] window.
Copying spectra
Spectra can be copied to the Clipboard. They can then be pasted into documents that are created with other applications. For more information, refer to “Copying the graphs” under “Common Graph Operations”.
Printing spectra
Spectra can be printed. For more information, refer to “Printing the panes” under “Common Pane Operations”.
Exporting spectra
Spectra can be exported in various graphics file formats. For more information, refer to “Exporting the graphs“ under “Common Graph Operations”.