Instrument Status Pane
This section describes the functions of the commands that are available in the Instrument Status pane.
Title Bar
Button
This section describes the function of the buttons at the right end of the title bar on the pane.
 Select how panes are displayed from the list.
For information on the functions of each command, refer to Context Menu.
 Temporarily hides the pane and displays only the
title bar. Hover over the title bar to open the pane.
Temporarily hides the pane and displays only the
title bar. Hover over the title bar to open the pane.
![]() Hides the pane. To show the
pane again:
Hides the pane. To show the
pane again:
Click [Panes] from the [Show] group on the [View] tab.
Click the [Settings] from the [Settings] group on the [Tools] tab and then click [Default] as the "Layout" from the [View] category.
Click [Panes] from the [Show] group on the [View] tab, and then select the pane you want to show.
Context Menu
This section describes the context menu that is displayed when you right-click on the title bar of the pane.
[Floating]
Changes the floating status of the pane. A floating window can be resized and positioned freely.
The floating status can also be changed by double-clicking or dragging the title bar.
[Dockable]
Drag the title bar of the pane to change the pane location.
[Auto Hide]
Temporarily hides the pane and displays only the title bar. Hover over the title bar to open the pane.
[Hide]
Hides the pane. To show the pane again:
- Click [Panes] from the [Show] group on the [View] tab.
- Click the [Settings] from the [Settings] group on the [Tools] tab and then click [Default] as the "Layout" from the [View] category.
- Click [Panes] from the [Show] group on the [View] tab, and then select the pane you want to show.
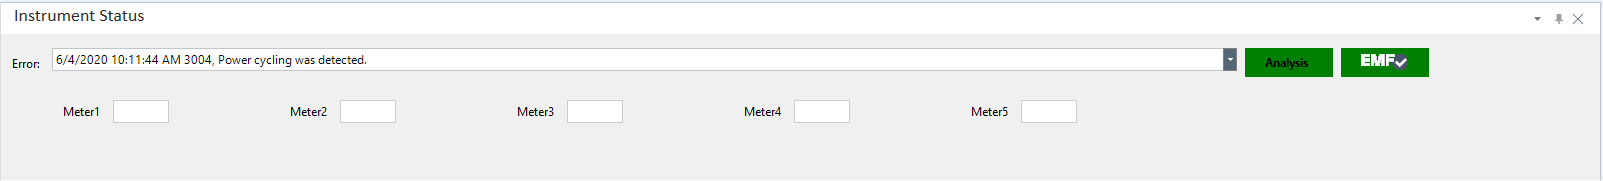
Pane Functions
[Error] List
Displays up to 20 hardware errors in reverse chronological order.
[Instrument Status] Button
Displays what mode the instrument is in.
Grey: The instrument is in Shutdown mode.
Orange: The instrument is in Standby mode. If you click the button, the plasma is ignited.
Blinking orange: The instrument mode is changing from Analysis Mode to Standby mode.
Green: The instrument is in Analysis Mode. If you click the button, the plasma is turned OFF.
Blinking green: The instrument mode is changing from Standby mode to Analysis Mode.
[EMF] Button
The Early Maintenance Feedback (EMF) function shows the items to check for maintenance.
Green: No items need to be checked for maintenance.
Red: Some items need to be checked for maintenance.
Click Dashboard Pane to display the details of EMF, perform necessary maintenance on each indicated item. For more information, refer to the hardware maintenance manual.
If you hover your mouse over the EMF button, a balloon will pop up to show the item needing checked. Clicking on the EMF will automatically open the Dashboard Pane to display the details.
[Meter1] to [Meter5]
Display the meters. To select the meter to display, see Checking the Instrument Status.
Context Menu
This section describes the context menu that is displayed when you right-click the [Error] list. The commands that are not listed below have the same function as their counterparts on the toolbars.
[Error Log View]
Displays the [Instrument Error Log Viewer] dialog box, which lets you check the error log.
[Clear Error Log]
Clears error messages.
The [Export Error Log] dialog box appears and export the file format that you specify the error message.
[Print Error Log]
Prints the error log.
[Export Error Log]
Displays the [Export Error Log] dialog box, which lets you export the error message in the specified file format.
To Get Here
- Select [Panes] - [Instrument Status] from the [Show] group on the [View] tab.