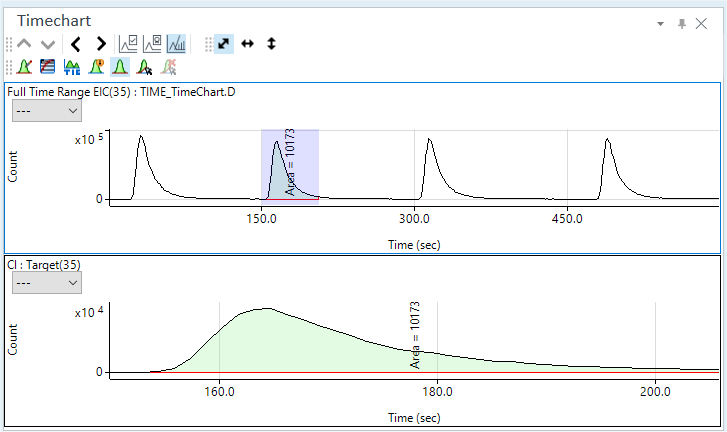
Timechart pane
This section describes the functions of the commands that are available in the Timechart pane.
- Title Bar
- Timechart Toolbar
- Functions (Spectrum/Chromatogram) Toolbar
- Zoom Toolbar
- Scale Dropdown List
- Context Menu
- To Get Here
Title Bar
The title bar buttons and the context menu have the same functions as the Title Bar of the Instrument Status Pane.
Timechart Toolbar
 Drag to move the toolbar.
 Displays
the timechart for the previous sample.
Displays
the timechart for the previous sample.
 Displays the timechart for the
next sample.
Displays the timechart for the
next sample.
 Displays
the previous mass peak.
Displays
the previous mass peak.
 Displays the next mass peak.
 Displays
or hides the ISTD Stability Graph.
Displays
or hides the ISTD Stability Graph.
 Displays
or hides the QC Sample Stability Graph.
Displays
or hides the QC Sample Stability Graph.
 Displays
or hides the Spectrum/Chromatogram.
Displays
or hides the Spectrum/Chromatogram.
Functions (Spectrum/Chromatogram) Toolbar
![]() Opens the
[Change Chart]
dialog box, which lets you view multiple data timecharts.
Opens the
[Change Chart]
dialog box, which lets you view multiple data timecharts.
![]() Changes
the display between log scale and linear scale.
Changes
the display between log scale and linear scale.
![]() Changes
the display between the total and the mass-specific timecharts.
Changes
the display between the total and the mass-specific timecharts.
![]() Opens the
[Chromatogram
Information] dialog box, which lets you configure the display settings
for the labels.
Opens the
[Chromatogram
Information] dialog box, which lets you configure the display settings
for the labels.
![]() Displays
or hides the peak baseline.
Displays
or hides the peak baseline.
![]() Starts manual
integration when selected. Stops manual integration when deselected.
Starts manual
integration when selected. Stops manual integration when deselected.
![]() Clears manual
integration.
Clears manual
integration.
Zoom Toolbar
The Zoom Toolbar have the same functions as the Zoom Toolbar of the Spectrum pane.
Scale Dropdown List
Lets you set the scale of the Y-axis.

Context Menu
This section describes the commands that are available in the context menu displayed by right-clicking in the pane. The commands that are not listed below have the same function as their counterparts on the toolbars and the Ribbon.
[Count Display Mode]
Displays or hides the tooltip display for the Count value.
[Annotate]
[Add/Remove Annotation]
Opens the [Add comment] dialog box where you can add comments to the graph. To clear a comment, click this icon, and then click the comment on the graph.
[Save Annotation in Data]
Click this item to save the contents of annotations in a batch after you have written annotations.
[Tabulate Chart]
[Raw Data to CSV]
Exports the raw data to a CSV file, and then opens the CSV file.
[CPS Data to CSV]
Exports the CPS data to a CSV file, and then opens the CSV file.
[Copy]
Copies the selected data to the Clipboard. When a graphics pane is selected, the graphics are copied.
[Page Setup]
Opens the [Page Setup] dialog box for configuring the page settings for printing.
[Print]
Opens the [Print] dialog box where you can print the contents of the selected pane.
[Print Preview]
Opens the [Print Preview] dialog box where you can display the print preview.
[Export Graphics]
Opens the [Export Graphics] dialog box where you can export the graphics data. This command is available when a pane that includes graphics is selected.
To Get Here
- Open the Timechart analysis batch result in the [ICP-MSICP-QQQ Data Analysis] window.
- Select [Panes] - [Spectrum/Timechart] from the [Show] group on the [View] tab in the [ICP-MSICP-QQQ Data Analysis] window.