QC Sample Stability Graph Pane Operation
This section describes the operation of the QC Sample Stability Graph pane. For descriptions of functions common to all panes, refer to “Common Pane Operations”.
QC Sample Stability Graph Pane
Displaying the QC Sample Stability Graph
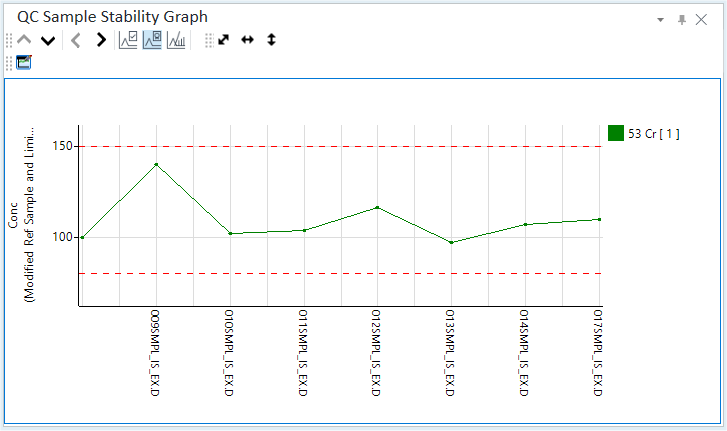
The QC Sample Stability Graph pane shows the Calibration Stability (%). The X-axis represents the sample name or the data file name, and the Y-axis represents the Calibration Stability (%). Calibration Stability is a measure of how stable the quantitative analysis results for the QC sample are.
If the QC
Sample Stability Graph pane is not shown, click [Panes] from
the [Show] group on the [View] tab. Also, check that  on
the toolbar is inverted. If is not inverted,
click it.
on
the toolbar is inverted. If is not inverted,
click it.
Toolbar Functions
For information on the functions of the toolbar, refer to “QC Sample Stability Graph pane” help topic.
Adjusting the scales
The scale for the X- and Y-axes can be changed. For more information, refer to “Adjusting the scales” under “Common Graph Operations”.
Shifting the axes
The X- and Y-axes can be transposed. For more information, refer to “Shifting the axes” under “Common Graph Operations”.
Expanding a selected area
You can zoom in on a selected area of the QC Sample Stability Graph. For more information, refer to “Expanding a selected area” under “Common Graph Operations”.
Customizing the QC sample stability graph
The QC Sample Stability Graph can be customized which QC samples to use for the stability calculation, which analytes to display the normal value range, and the X-axis contents.
- Click the
 icon on the toolbar.
The [QC Sample Stability Graph Setting] dialog box is displayed.
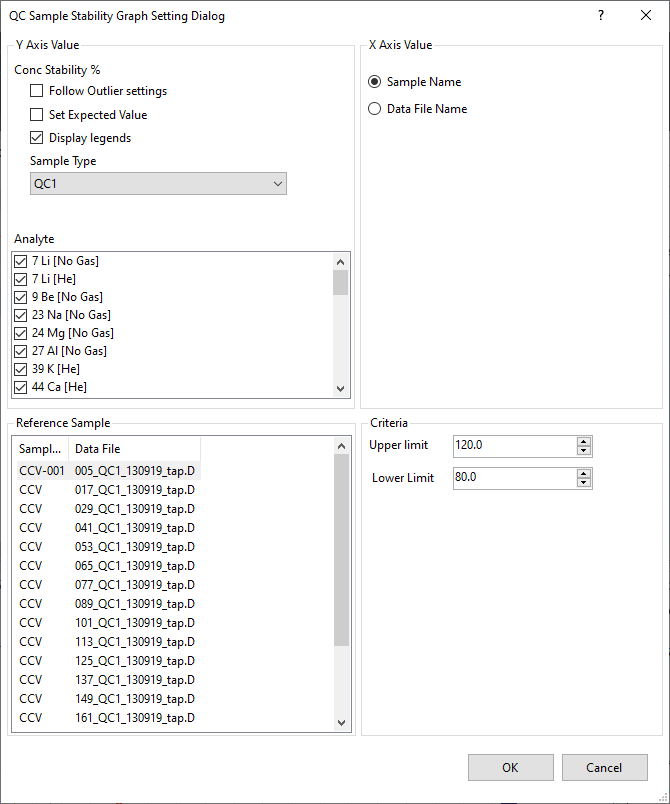
[QC Sample Stability Graph Setting] Dialog Box
- Clear the [Follow Outlier Settings] check box.
- Change the display settings for the QC Sample Stability Graph.
For information on these settings refer to the Help for the [QC Sample Stability Graph Setting] dialog box.
- When finished, click <OK>.
The QC Sample Stability Graph is updated.
Copying the QC sample stability graph
The QC Sample Stability Graph can be copied to the Clipboard. It can then be pasted into documents that are created with other applications. For more information, refer to “Copying the graphs” under “Common Graph Operations”.
Printing the QC sample stability graph
The QC Sample Stability Graph can be printed. For more information, refer to “Printing the panes” under “Common Pane Operations”.
Exporting the QC sample stability graph
The QC Sample Stability Graph can be exported in various graphics file formats. For more information, refer to “Exporting the graphs” under “Common Graph Operations”.