Interface
Agilent Report Designer is an application used to design and generate reports for the Agilent product range.
The application is launched from within the Agilent instrument host software.
Designer Overview
Most of the main window is the report design canvas. Report items represent the parts of the report such as headers, footers, images, data tables, and so forth. By dragging report items from the design toolbox onto the canvas you create a report template. As with any editor, you use the File menu to save and load your work to and from disk.
To design a report, select a report template and then connect data. The report designer allows access to real data (stored in a file or database depending on the technique), which is used to create a template. Some host applications that access the Report Designer will connect the data differently. See your host application documentation or Help for additional information.
The main window of the Report Designer software is made up of the Quick Access Toolbar, the Tabs
and Ribbon, and three panes. You can minimize or maximize the
three main panes by dragging the handlebar on the right side of the Design Toolbox pane or
on the left side of the Live Preview
pane. To view or hide a pane click the 'View' tab and then select
or deselect the required pane.
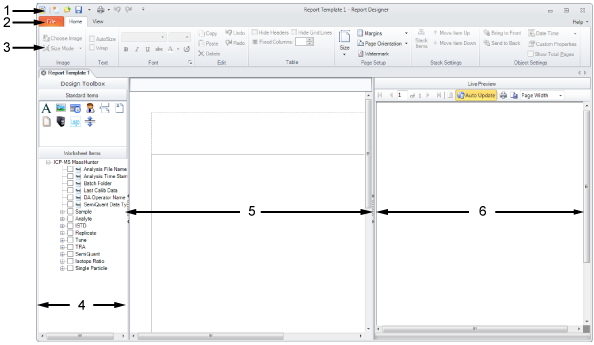
Where:
- Quick Access Toolbar
- Tabs
- Ribbon
- Design Toolbox
- Design Canvas
- Live Preview
Design Toolbox
The Design Toolbox pane contains all available report items including Standard Items that are not data specific and Worksheet Items that are defined by the data file used as part of the template. Standard Items can be placed onto the canvas by dragging and dropping. Also, Worksheet Items can be placed onto the canvas by selecting the check boxes.
Design Canvas
The canvas is the area where the report items are placed to build a report template.
Live Preview
This panel provides a continuously updated live view of the canvas. Depending on the display type chosen, the Live Preview will display all or part of the actual page.