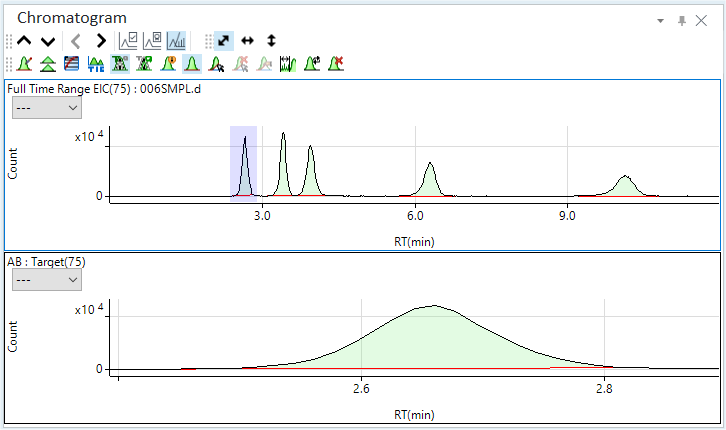
Chromatogram pane (Option)
This section describes the function of the commands that are available in the Chromatogram pane (Option), which is displayed when you analyze samples with the optional Chromatographic Analysis software.
- Title Bar
- Spectrum/Chromatogram Toolbar
- Functions (Spectrum/Chromatogram) Toolbar
- Zoom Toolbar
- Scale Dropdown List
- Context Menu
- To Get Here
Title Bar
The title bar buttons and the context menu have the same functions as the Title Bar of the Instrument Status Pane.
Spectrum/Chromatogram Toolbar
 Drag to move the toolbar.
 Displays
the graph for the previous sample.
Displays
the graph for the previous sample.
 Displays the graph for the next
sample.
Displays the graph for the next
sample.
 Displays
the graph for the previous element.
Displays
the graph for the previous element.
 Displays the graph for the next
element.
Displays the graph for the next
element.
 Displays
or hides the ISTD Stability Graph.
Displays
or hides the ISTD Stability Graph.
 Displays
or hides the QC Sample Stability Graph.
Displays
or hides the QC Sample Stability Graph.
 Displays
or hides the Spectrum/Chromatogram.
Displays
or hides the Spectrum/Chromatogram.
Functions (Spectrum/Chromatogram) Toolbar

![]() Opens the
[Change Chart]
dialog box for viewing the chromatogram for multiple data.
Opens the
[Change Chart]
dialog box for viewing the chromatogram for multiple data.
![]() When
multiple data are plotted as chromatograms, the chromatograms are plotted
separately rather than overlaid. The chromatograms also can be inverted.
When
multiple data are plotted as chromatograms, the chromatograms are plotted
separately rather than overlaid. The chromatograms also can be inverted.
![]() Changes
the display between log scale and linear scale.
Changes
the display between log scale and linear scale.
![]() Changes
the display between TIC (total
ion chromatogram) and EIC (extraction
ion chromatogram).
Changes
the display between TIC (total
ion chromatogram) and EIC (extraction
ion chromatogram).
![]() Displays
or hides the target ions.
Displays
or hides the target ions.
![]() Displays
or hides the qualifier ions.
Displays
or hides the qualifier ions.
![]() Opens the
[Chromatogram
Information] dialog box, which lets you configure the display settings
for labels.
Opens the
[Chromatogram
Information] dialog box, which lets you configure the display settings
for labels.
![]() Displays
or hides the peak baseline.
Displays
or hides the peak baseline.
![]() Starts manual
integration when selected. Stops manual integration when deselected.
Starts manual
integration when selected. Stops manual integration when deselected.
![]() Clears manual
integration.
Clears manual
integration.
![]() Performs
manual integration along the peak.
Performs
manual integration along the peak.
![]() Sets the
noise range for when displaying the S/N ratios on the peaks.
Sets the
noise range for when displaying the S/N ratios on the peaks.
![]() Opens the
[Update
Method for Current Peak] dialog box, which lets you update the retention
time and relative response that are specified in the analysis method with
the values for the current peak.
Opens the
[Update
Method for Current Peak] dialog box, which lets you update the retention
time and relative response that are specified in the analysis method with
the values for the current peak.
![]() Enters peak
deletion mode. If you click a peak that has been auto-integrated, the
auto-integration is cleared. For more information, refer to "Deleting
Peaks".
Enters peak
deletion mode. If you click a peak that has been auto-integrated, the
auto-integration is cleared. For more information, refer to "Deleting
Peaks".
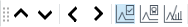
Zoom Toolbar
The Zoom Toolbar have the same functions as the Zoom Toolbar of the Spectrum pane.
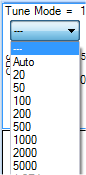
Scale Dropdown List
Lets you set the scale of the Y-axis.
Context Menu
This section describes the commands that are available in the context menu, which is displayed when you right-click in the pane. The commands that are not listed below have the same function as their counterparts on the toolbars and the Ribbon.
[Count Display Mode]
Displays or hides the tooltip display for the Count value.
[Annotate]
[Add/Remove Annotation]
Opens the [Add comment] dialog box where you can add comments to the graph. To clear a comment, click this icon, and then click the comment on the graph.
[Save Annotation in Data]
Click this item to save the contents of annotations in a batch after you have written annotations.
[Tabulate Chart]
[Raw Data to CSV]
Exports the raw data to a CSV file, and then opens the CSV file.
[CPS Data to CSV]
Exports the CPS data to a CSV file, and then opens the CSV file.
[Copy]
Copies the selected data to the Clipboard. When a graphics pane is selected, the graphics are copied.
[Page Setup]
Opens the [Page Setup] dialog box where you can configure the page settings for printing.
[Print]
Opens the [Print] dialog box where you can print the contents of the selected pane.
[Print Preview]
Opens the [Print Preview] dialog box where you can display the print preview.
[Export Area Percent Report]
[All]
Displays the Area Percent Report of all peaks selected in the Batch table, including TIC and the peaks not registered in the peak list on the method editor. The [Area Percent Report] dialog box appears. Enter the report file name and click [Save]. The report is displayed.
[All Quantitated Masses]
Displays the Area Percent Report of the quantitated masses for the sample selected in the Batch table. The [Area Percent Report] dialog box appears. Enter the report file name and click [Save]. The report is displayed.
[Selected Mass]
Displays the Area Percent Report of the masses selected in the Batch table. The [Area Percent Report] dialog box appears. Enter the report file name and click [Save]. The report is displayed.
[Export Signal to Noise Report]
Opens the [Signal to Noise Report] dialog box. Enter a report file name and click [Save]. Signal to Noise Report is displayed.
[Export Graphics]
Opens the [Export Graphics] dialog box where you can export the graphics data. This command is available when a pane that includes graphics is selected.
To Get Here
- Open the Timechart analysis batch result in the [ICP-MSICP-QQQ Data Analysis] window.
- Select [Panes] - [Spectrum/Timechart] from the [Show] group on the [View] tab in the [ICP-MSICP-QQQ Data Analysis] window.