Chromatogram Pane Operations
This section explains the operation of the Chromatogram pane (Option), which is displayed when you analyze samples with the optional Chromatographic Application. For information about functions that are common to all panes, refer to “Common Pane Operations”.
Chromatogram Pane
Displaying Chromatograms
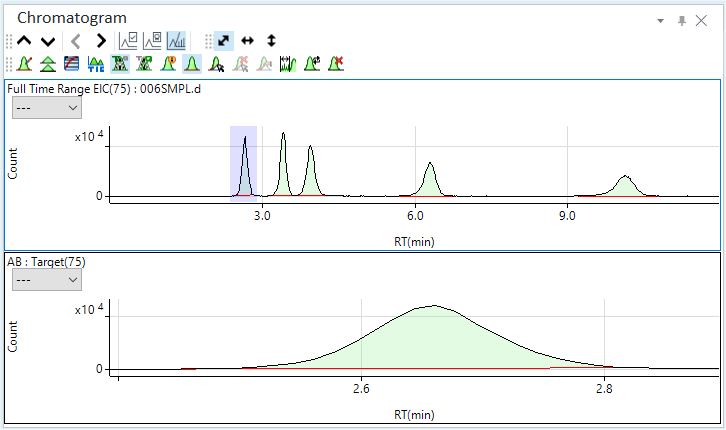
The Chromatogram pane (Option is displayed when you load data for which the Analysis Mode is set to “Chromatogram”. The chromatogram for the sample that is selected in the Batch Table is displayed in the Chromatogram pane (Option).
The Chromatogram pane (Option) has two rows. The upper row displays a chromatogram for the entire time range of an EIC (extracted ion chromatogram), and highlights the currently selected peak in purple. The lower row displays an expanded view of the analyte peak that is selected on the Batch table. In both rows, the X-axis represents the retention time in minutes, and the Y-axis represents the counts.
To display a different chromatogram in the Chromatogram pane (Option), click one of the following icons on the Chromatogram pane toolbar.
 Displays
the chromatogram for the previous sample.
Displays
the chromatogram for the previous sample.
 Displays the chromatogram for the
next sample.
Displays the chromatogram for the
next sample.
 Selects
the previous peak.
Selects
the previous peak.
 Selects the next peak.
If the Chromatogram pane (Option) pane is not shown,
click [Pane] from the [Show] group on the [View] tab. Also check that
 on
the toolbar is selected (when a toolbar icon is selected, it is highlighted
in a darker shade). If not, click to select it.
on
the toolbar is selected (when a toolbar icon is selected, it is highlighted
in a darker shade). If not, click to select it.
Toolbar Functions
For the functions of the toolbar, refer to “Spectrum pane” help topic.
Adjusting the scales
The scale for the X-and Y-axes can be changed. For more information, refer to “Adjusting the scales” under “Common Graph Operations”.
Shifting the axes
The X-and Y-axes can be transposed. For more information, refer to “Shifting the axes” under “Common Graph Operations”.
Expanding a selected area
You can zoom in on a selected area of the chromatogram. For more information, refer to “Expanding a selected area” under “Common Graph Operations”.
Changing the display type
You can change the chromatogram display type by clicking on the toolbar icons.
![]() Displays or
hides the tooltip display for the Count
value.
Displays or
hides the tooltip display for the Count
value.
![]() Displays or
hides the peak baseline.
Displays or
hides the peak baseline.
![]() Changes the
display between TIC (total
ion chromatogram) and EIC (extraction
ion chromatogram). By default, EIC is displayed. Click and invert
Changes the
display between TIC (total
ion chromatogram) and EIC (extraction
ion chromatogram). By default, EIC is displayed. Click and invert ![]() to display the TIC.
to display the TIC.
![]() Displays or
hides the Target ion.
Displays or
hides the Target ion.
![]() Displays or
hides the qualifier ions.
Displays or
hides the qualifier ions.
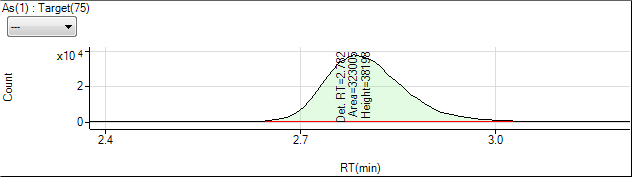
Displaying labels
Labels can be displayed in the upper-row chromatogram and the lower-row peak, as shown below.
Label Display
To display the labels, follow these steps:
Click the
 icon on the
toolbar.
icon on the
toolbar.Select the items to display.
- [EIC/TIC]: Select the items to display in the upper chromatogram.
- [Analyte]: Select the items to be displayed in the lower chromatogram.
Click <OK>.
The selected labels are shown in the chromatograms.
The [Chromatogram Information] dialog box is displayed.
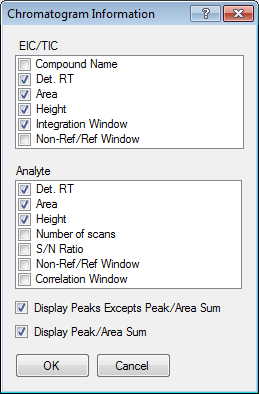
[Chromatogram Information] Dialog Box
To hide all labels, clear all checks in the [Chromatogram Information] dialog box and click <OK>.
Displaying mass spectra
You can view the mass spectra for any time slice.
Place the cursor at a desired point on the chromatogram, then double-click to display the mass spectra for that particular point in time.
To display the mass spectrum for another peak, click
on the toolbar in the Spectrum pane.
To return to the chromatogram display, double-click on the pane.
Adding comments
Comments can be added to the chromatograms.
Adding a comment
To add a comment, follow these steps:
- Click the
 icon on the toolbar.
The icon is selected, and the cursor changes to
 .
. - Click at the location to add the comment.
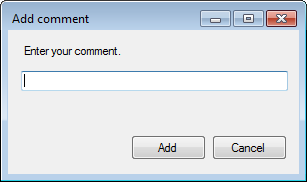
The [Add comment] dialog box is displayed.
[Add comment] Dialog Box
- Type in your comment.
- Click <Add>.
The comment is shown at the specified point on the chromatogram.
- When finished, click
 again.
To save an annotation in the batch, select the [Annotate] - [Save Annotation in Data] from the context menu.
Deleting comments
To delete comments, follow these steps:
- Click the
 icon on the toolbar.
The icon is selected, and the cursor changes to
 .
. - Move the cursor towards the comment to be deleted. When the cursor
changes to
 , click the mouse.
The comment is deleted.
- When finished, click
 again.
Deleting Peaks
You can delete or restore a peak that has been auto-integrated.
A deleted peak cannot be used for a calibration point, FQ blank, and so on. Also, the peak is not displayed in a report.
To delete a peak, complete the following steps:
- Click
 on the toolbar.
"Peak deletion" mode is enabled.
- Move the cursor to the peak that has been auto-integrated.
The cursor changes to
 .
. - Click the peak.
Auto-integration for the peak is cleared and a red cross is displayed above the peak.
The cells corresponding to the peak in the batch list become blank.
Follow the steps below to restore a peak that was deleted using this function.
- Click
 on the toolbar.
"Peak deletion" mode is enabled.
- Move the cursor to the deleted peak.
The cursor changes to
 .
. - Click the peak.
The peak is restored.
Manual integration
You can manually integrate the peaks that are not set as analytes in the data analysis method displayed in the upper Chromatogram pane (Extracted Ion Chromatograms). You can also change and manually integrate the peaks that have been set as the analytes in the data analysis method in the lower pane.
Peaks that were processed by autointegration are shown in green lines. Unknown peaks that cannot be processed by autointegration are shown in white.
To perform manual integration, follow these steps:
- If
 on the toolbar is on the toolbar
is selected (when a toolbar icon is selected, it is highlighted in
a darker shade), click to deselect (inactivate).
on the toolbar is on the toolbar
is selected (when a toolbar icon is selected, it is highlighted in
a darker shade), click to deselect (inactivate).
If
 is not selected, click to select (activate).
The Chromatogram is displayed in the upper pane, while an expanded view of the selected peak is displayed in the lower pane.
- To manually integrate in the lower pane, use and
to select the peak to be integrated manually.
- Click the
 icon on the toolbar. To perform
manual integration along the peak, also click
icon on the toolbar. To perform
manual integration along the peak, also click  .
.
Move the cursor towards the peak in the lower row. The cursor changes to a
 .
. - Click and drag the start or end black circle to specify the integration
range.
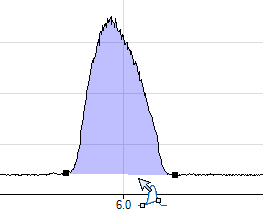
Manual Integration
- Release the mouse button.
Integration is performed and the Batch Table is updated for the analyte that was integrated manually in the lower pane.
- When finished, click
 again.
 - To clear the manual integration results for a known peak, click
the
 icon on the toolbar.
If you integrate unknown peaks, you will not be able to view the integration results in the Batch Table. Right-click on the Chromatogram pane and select [Export Area Percent Report] from the context menu to view the integration results. For peaks that have been manually integrated, "(M)" is displayed in the peak #.
Move the cursor near the manually integrated peak and
click it when the cursor changes to ![]() .
Note that you cannot clear all manually-integrated peaks together at once.
Clear them one by one.
.
Note that you cannot clear all manually-integrated peaks together at once.
Clear them one by one.
Displaying multiple chromatograms
This function is not available on the Chromatogram pane that is displayed in the [Method Editor] window. Use this function on the Chromatogram pane displayed in Batch-at-a-Glance. By default, the Chromatogram pane (Option) displays the chromatogram for one data only. However, you can also overlay chromatograms for multiple data for comparison.
Displaying multiple chromatograms
To display multiple chromatograms, follow these steps:
- Click the
 icon on the toolbar.
The [Change Chart] dialog box is displayed.
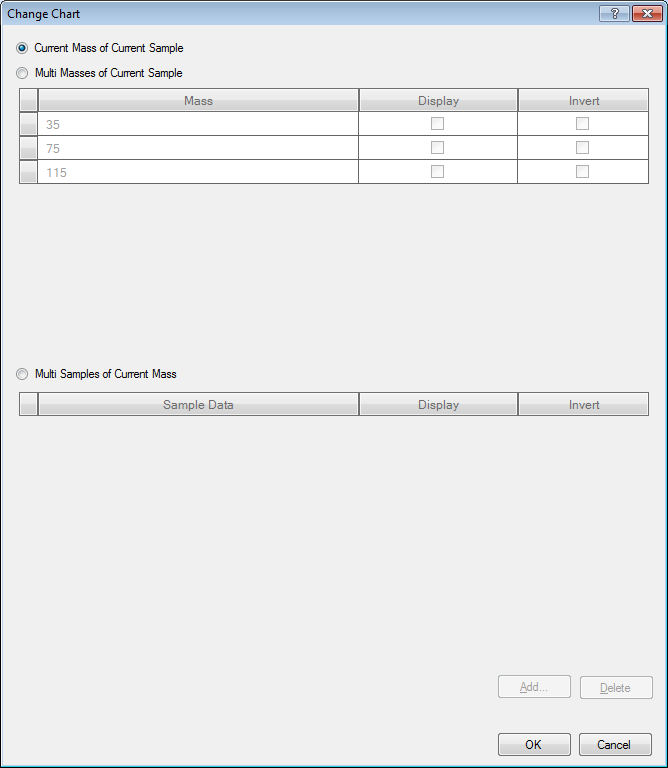
[Change Chart] Dialog Box
The following settings are available:
- For the current sample, show the chromatogram for the current
mass (default)
Select [Current Masses of Current Sample].
- For the current sample, show the chromatogram for multiple
masses
Select [Multi Masses of Current Sample], and then in the [View] column, mark the check boxes for the masses to display. To display the peaks upside down, mark the check boxes in the [Invert] column.
- For the current mass, show the chromatogram for multiple samples
Select [Multi Samples of Current Mass], select the data in the dialog box that is displayed, and click <Add>. In the [View] column, mark the check box for the sample data to display. To display the peaks upside down, mark the check boxes in the [Invert] column.
- For the current sample, show the chromatogram for the current
mass (default)
- When finished, click <OK>.
The chromatograms are overlaid.
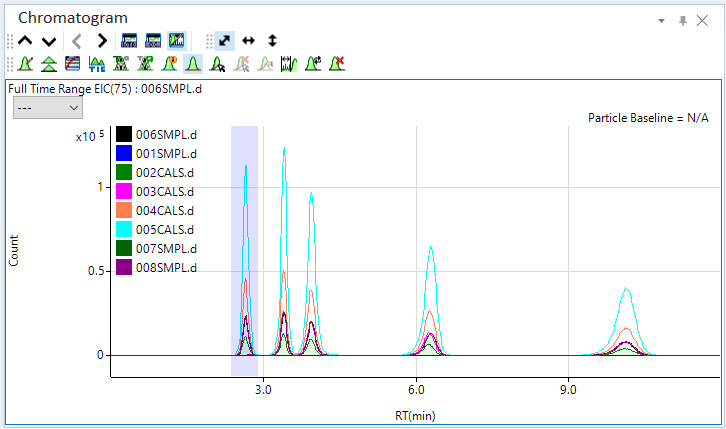
Superimposed Chromatogram
To display respective chromatograms in separate graphs, click
 the toolbar.
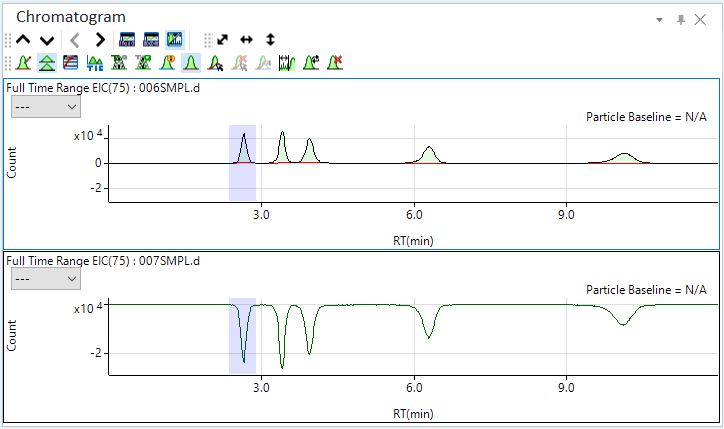
Superimposed Chromatogram
Resetting the display of multiple chromatograms
To reset the overlaid chromatograms to the original state, follow these steps:
- Click the
 icon on the toolbar.
The [Change Chart] dialog box is displayed.
- Select [Current Mass of Current Sample] and click <OK>.
The original view is restored.
Displaying the S/N ratio
You can test the reliability of the chromatography results by calculating the signal-to-noise (S/N) ratio of the peaks.
To calculate and display the S/N ratio of the peaks, you must first set the noise range on the Chromatogram pane. Setting the range on the upper row (Extracted Ion Chromatogram) of the Chromatogram pane applies the specified noise range to all compounds. Setting the range on the lower row (Selected Peak) applies the specified range to the particular compound only.
You may only specify one noise range for each chromatogram. To change the noise range, simply specify a different range.
Displaying the S/N ratio on the labels
To display the S/N ratios on the peaks, configure the peak labels to display S/N ratios.
To display the S/N ratios on the labels, do the following:
- Click
 on the toolbar.
The [Chromatogram Information] dialog box is displayed.
- If the [S/N ratio] check box on the [Chromatogram
Information] dialog box is not marked, mark it.
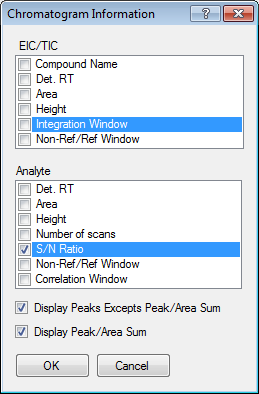
Chromatogram Information Dialog Box
- Click [OK].
The S/N ratios will now be displayed in the peak labels.
Proceed to “Setting the noise range”.
Setting the noise range
On the Chromatogram pane, set the noise range to use to calculate the S/N ratios.
- Click
 on the toolbar.
The icon is selected, and the cursor changes to
 .
.
- Drag the mouse to specify the desired range.
The noise range for calculating the S/N ratios is now set.
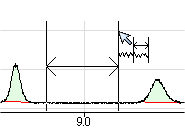
Setting the Noise Range
- Click [Process Batch] from the [Batch Option] group on the [Home]
tab.
S/N ratios are displayed in the peaks in the lower row.
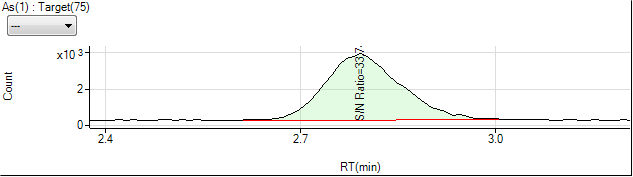
S/N Ratio Display
You can add an S/N Ratio column to the Batch Table. See “Adding/Removing columns”.
You can also check the S/N ratios on the Signal to Noise Report. For details, refer to “Displaying the S/N ratio”.
Clearing the noise range
To clear the specified noise range, do the following:
- If
 on the toolbar is not selected, click
it.
on the toolbar is not selected, click
it.
The icon is selected, and the cursor changes to
 .
.
- Move to the noise range to clear.
The cursor changes to
 .
. 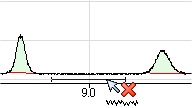
Clearing the Noise Range
- Click the mouse.
The noise range is cleared, as are the S/N ratios displayed in the peaks in the lower row.
- Click [Process Batch] from the [Batch Option] group on the [Home]
tab.
The analysis results are updated.
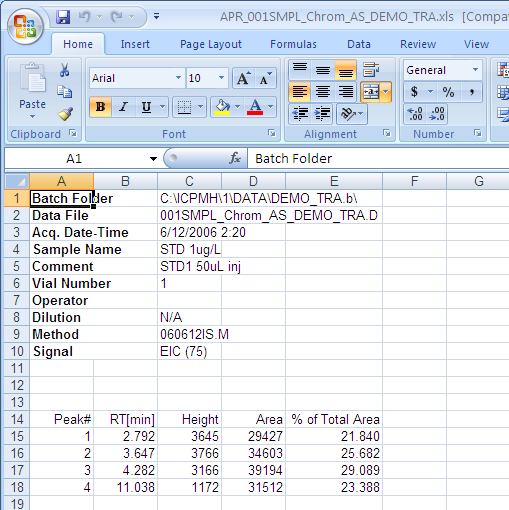
Exporting the Signal to Noise report
This function is not available on the Chromatogram pane that is displayed in the [Method Editor] window. Use this function on the Chromatogram pane that is displayed in Batch-at-a-Glance. The Chromatogram Signal to Noise Report can be created as a file.
The following file formats are available:
- Excel 97- 2003 File (*.xls)
- Comma- separated values File (*.csv)
- Tab Delimited File (*.txt)
However, you can select an Excel file only when the Excel is installed.
The created report can be edited and graphed in the associated application.
When using ECM, OpenLab Server Products, Workstation Plus, or SDA, the displayed dialog box and the save file destination differ from standard MassHunter operations. For more information, refer to "Operations When Database Systems Are Used" in "Reference".
- Set the noise range as described in “Setting the noise range”.
- Right-click on the Chromatogram
pane (Option).
The context menu is displayed.
- Select [Export Signal to Noise Report].
The [Signal to Noise Report] dialog box is displayed.
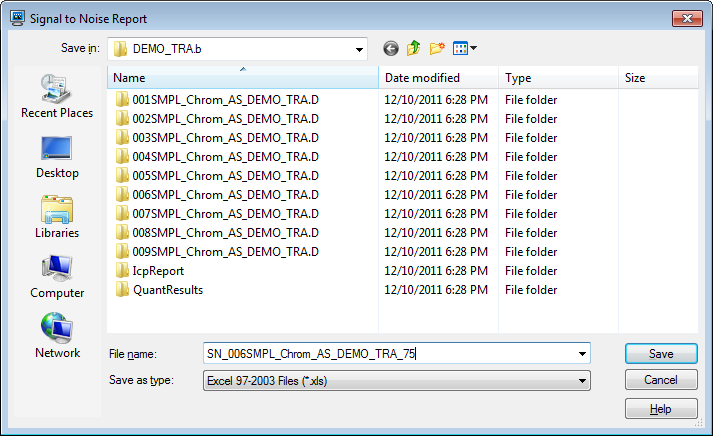
[Signal to Noise Report] dialog box
- Enter a file name, then click <Save>.
The Signal to Noise Report opens in the associated application.
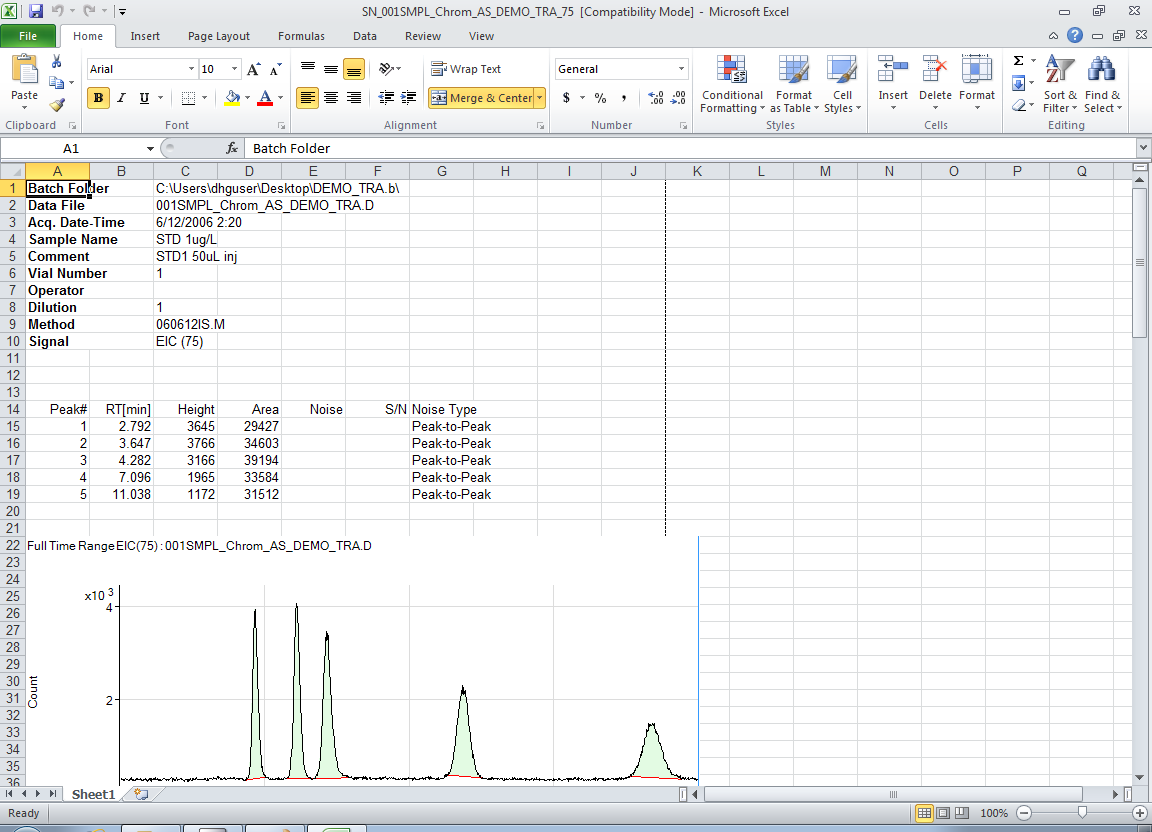
Signal to Noise Report (when using Excel)
- After you view the report, close the application.
Be sure to process the batch after you set the noise range.
Updating methods
If the current peak values do not match the values in the analysis method, for example due to the deterioration of the column, the analysis method can be updated with the values for the current peak. This function lets you make changes to the analysis method from the Chromatogram pane, so that you do not have to open the [Method Editor] window.
This function is useful for qualifier ions.
- Use and , to select the analysis method to update.
- Click
 .
.
The [Update Method for Current Peak] dialog box is displayed.
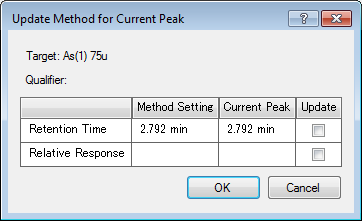
The values for the analysis method and the current peak are displayed.
- Mark the Update check box for the items to update.
- Click [OK].
The selected items are updated on the analysis method.
- Click [Process Batch] from the [Batch Option] group on the [Home]
tab.
The analysis results are updated.
Exporting the Area Percent report
The Chromatogram Area Percent Report can be created as a file.
The following file formats are available:
- Excel File (*.xlsx)
- Excel 97- 2003 File (*.xls)
- Comma Separated Values File (*.csv)
- PDF File (*.pdf)
However, you can select an Excel file only when the Excel is installed.
The created report can be edited and graphed in the associated application.
By selecting the submenu in the context menu, you can create the following three types of Area Percent reports.
[All]: Lets you select one or more samples from the Batch table and creates the Area Percent report of all peaks. You can create the Area Percent report of all peaks including masses not quantitated and TIC. When using Excel, an Excel sheet is created for each sample and mass.
[All Quantitated Masses]: Lets you select one or more samples from the Batch table and creates the Area Percent report of the peaks for the quantitated masses (EIC). When using Excel, an Excel sheet is created for each sample if multiple samples are selected.
[Selected Mass]: Lets you select a mass of a sample from the Batch table and creates the Area Percent report of all peaks for the selected mass (EIC) included in the selected sample.
When using ECM, OpenLab Server Products, Workstation Plus, or SDA, the displayed dialog box and the save file destination differ from standard MassHunter operations. For more information, refer to "Operations When Database Systems Are Used" in "Reference".
- From the Batch table, select one or more samples or masses used
to create a report.
The contents to be selected vary depending on the type of the Area Percent report you want to create. For details, refer to the above NOTE.
- Right-click on the Chromatogram
pane (Option).
The context menu is displayed.
- Select [Export Area Percent Report].
- According to the type of the report you want to create, select
[All], [All Quantitated Masses], or [Selected Mass] form the submenu.
The [Area Percent Report] dialog box is displayed.
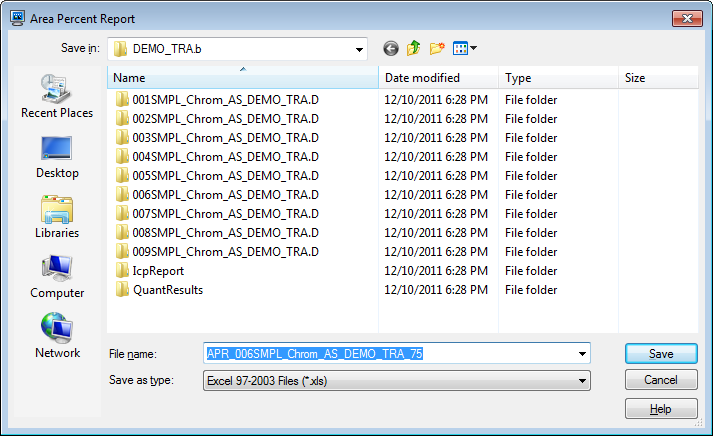
[Area Percent Report] dialog box
- Enter a file name, then click <Save>.
The Area Percent Report opens in the associated application.
Area Percent Report (when using Excel)
- After you view the report, close the application.
Tabulating raw and CPS data
A CSV format table can be created based on the raw or CPS data for the chromatogram.
A listing of the mass count or CPS for each time unit are created and displayed in the associated application.
The created table can be edited and graphed in the associated application.
Right-click on the Chromatogram pane (Option).
The context menu is displayed.
- Select [Tabulate
Chart], and select one of the following commands from the submenu.
- [Raw Data to CSV]: Exports the raw data in CSV format, and then opens it.
- [CPS Data to CSV]: Exports the CPS data in CSV format, and then opens it.
- The associated application starts, and the raw or CPS data for
the chromatogram is displayed.
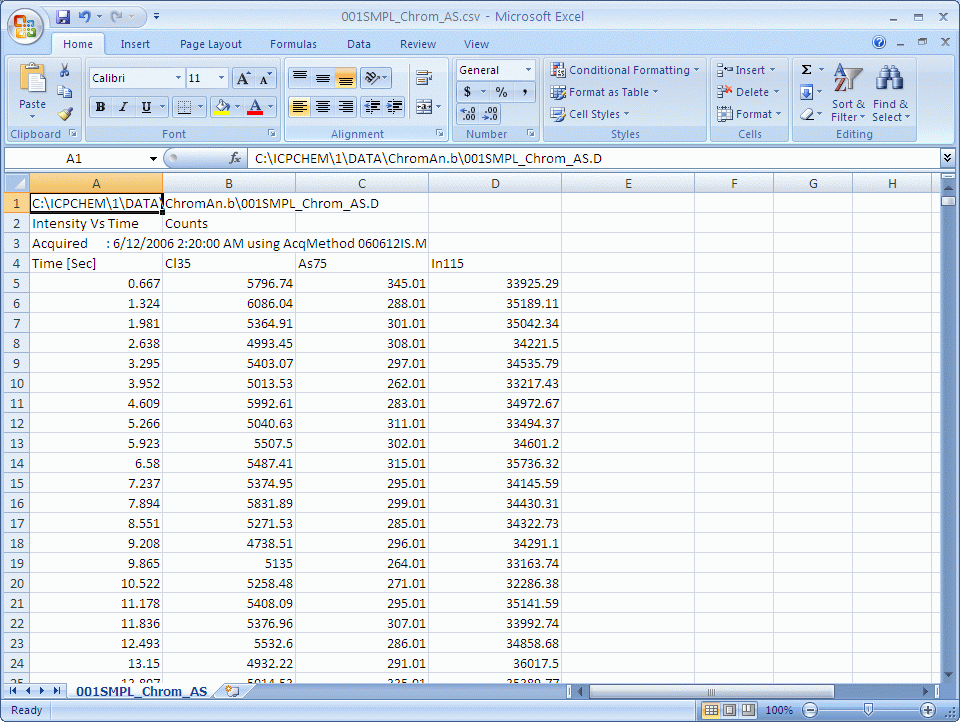
Raw Data Table for the Chromatogram (when using Excel)
- Close the application.
The [ICP-MSICP-QQQ Data Analysis] window is displayed.
Copying chromatograms
Chromatograms can be copied to the Clipboard. They can then be pasted into documents created with other applications. For more information, refer to “Copying the graphs” under “Common Graph Operations”.
Generating the Quick Batch Report
To print a summary of the analysis results, print a Quick Batch Report. For more information, refer to “Generating the Quick Batch Report” under “Common Data Analysis Operations”.
Printing chromatograms
Chromatograms can be printed. For more information, refer to “Printing the panes” under “Common Pane Operations”.
Exporting chromatograms
Chromatograms can be exported in various graphics file formats. For more information, refer to “Exporting the graphs” under “Common Graph Operations”.