Common Data Analysis Operations
This section explains data analysis procedures common to all analysis modes.
- Opening the Data Analysis window
- Creating a batch folder
- Loading a batch result
- Loading the data
- Sample type setup
- Creating or Changing a Data Analysis method
- Executing analyses
- Checking and correcting the analysis data
- Saving the analysis results
- Generating the Quick Batch Report
- Generating the analysis results report
- Displaying the Lab QC file
- Closing the Data Analysis window
Opening the Data Analysis window
If the [ICP-MSICP-QQQ Data Analysis] window is not open, open it. To open the [ICP-MSICP-QQQ Data Analysis] window, complete the following step:
- Click [Start] on the Windows taskbar and select [ICP-MS MassHunter
Workstation] >> [Offline Data Analysis], or double-click the
shortcut icon
 on the Windows desktop.
The [Offline ICP-MSICP-QQQ Data Analysis] window is displayed.
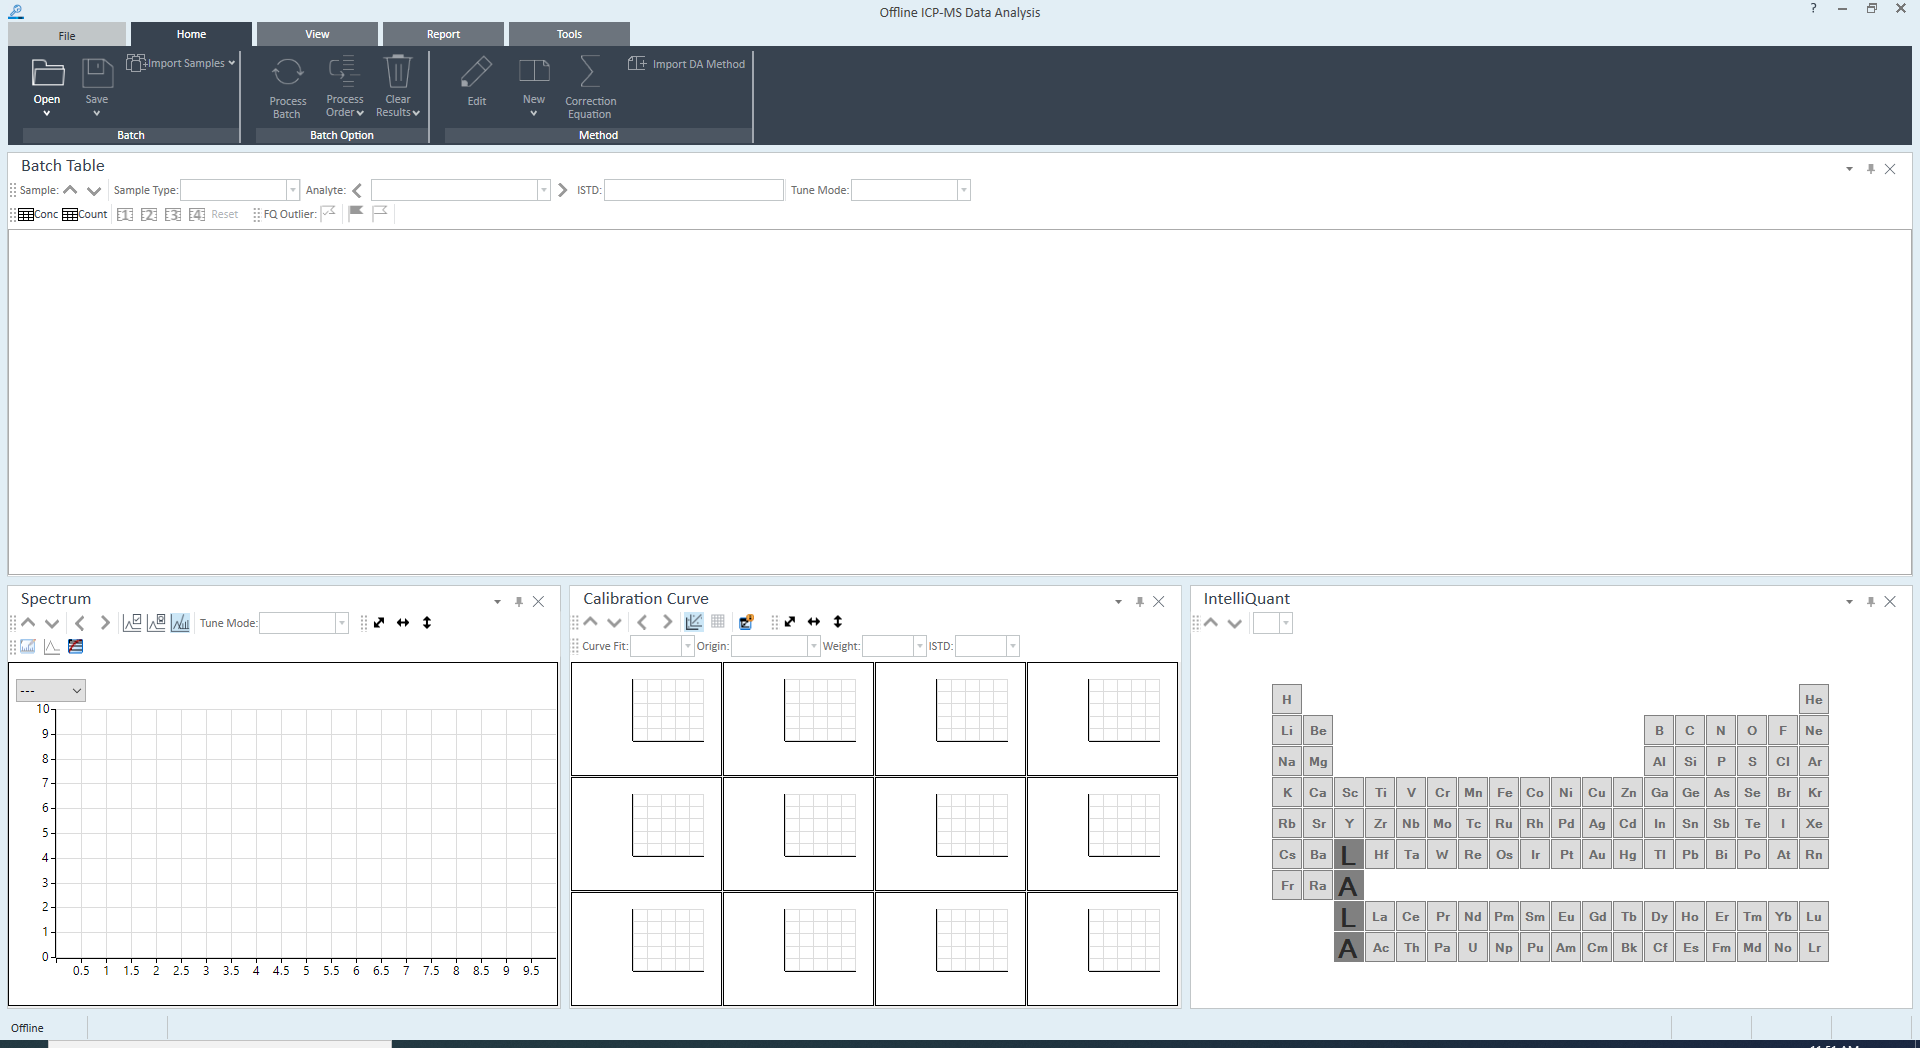
[ICP-MSICP-QQQ Data Analysis] Window
Creating a batch folder
When creating new analysis data, create a new Batch Folder. To create a new Batch Folder, follow these steps:
When using ECM, OpenLab Server Products, Workstation Plus, or SDA, the displayed dialog box and the save file destination differ from standard MassHunter operations. For more information, refer to " Operations When Database Systems Are Used" in "Reference".
- Click [New Batch Folder] on the [File] tab and click [Browse].
The [New Batch Folder] dialog box is displayed.
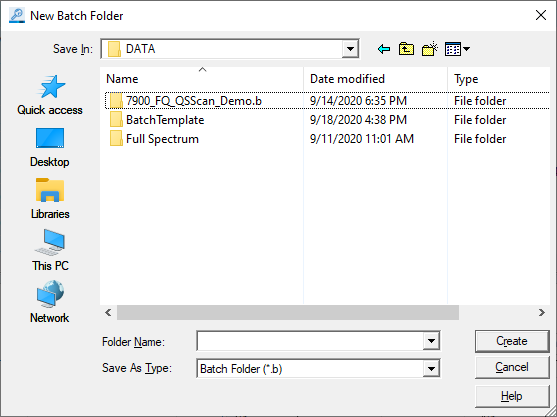
[New Batch Folder] Dialog Box
- Open the folder to create the Batch Folder in, enter the folder
name into the [Folder Name] text box, and click <Create>.
The Batch Folder for storing the analysis results is created.
Loading a batch result
To load an existing Batch Result, follow these steps:
This operation is not required when performing the procedures for “Creating a batch folder”.
When using ECM, OpenLab Server Products, Workstation Plus, or SDA, the displayed dialog box and the save file destination differ from standard MassHunter operations. For more information, refer to " Operations When Database Systems Are Used" in "Reference".
- Click [Open] from the [Batch] group on the [Home] tab.
The [Open Batch Result] dialog box is displayed.
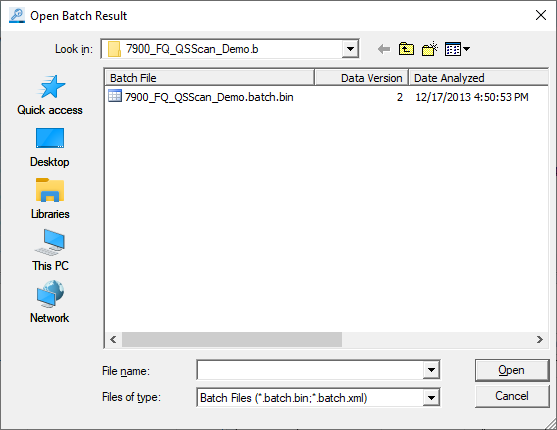
[Open Batch Result] Dialog Box
- Select the Batch
Result to use for the analysis, and click <Open>.
The data is displayed in the [ICP-MSICP-QQQ Data Analysis] window.
Loading the data
If a new batch folder was created, data that is required for the analysis (such as the standard sample for the calibration curve, the background data, and the unknown samples data) must be loaded into the Batch Table pane. You can also load the data after you create the Data Analysis Method.
Use either of the following ways to load the data:
When using ECM, OpenLab Server Products, Workstation Plus, or SDA, the displayed dialog box and the save file destination differ from standard MassHunter operations. For more information, refer to " Operations When Database Systems Are Used" in "Reference".
Loading from a data folder
To load the data from a data folder (*.D), follow these steps:
- Click [Import Samples] - [Import Samples] from the [Batch] group
on the [Home] tab.
The [Select Data File Folder] dialog box is displayed.
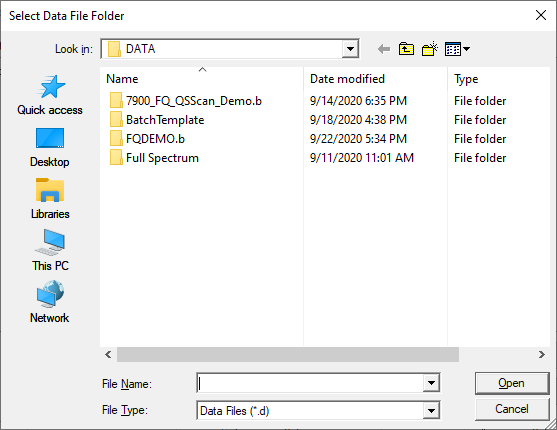
[Select Data File Folder] Dialog Box
- Select the data folder (*.D), and click <Open>.
The [Import Samples] dialog box is displayed, and the data files that are contained in the selected folder are listed.
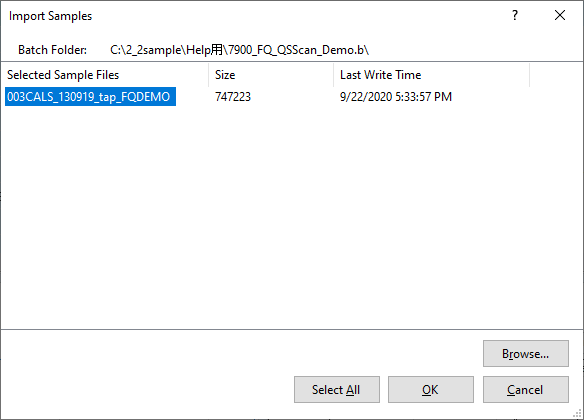
[Import Samples] Dialog Box
- To load additional data files from another folder, click <Browse...>.
Repeat steps 2 and 3 to select multiple data files.
- Select the data files of interest, and click <OK>. (Multiple
selection allowed)
The data is displayed in the Batch Table pane of the [ICP-MSICP-QQQ Data Analysis] window.
Loading from a batch folder
To load the all data from a batch folder (*.B), follow these steps:
This operation is not required if you have performed the procedures for “Loading from a data folder”.
- Click [Import Samples] - [Import All Samples from Batch] from the [Batch] group on the [Home] tab.
- Select a batch folder (*.B), and click <Open>.
The data is displayed in the Batch Table pane of the [ICP-MSICP-QQQ Data Analysis] window.
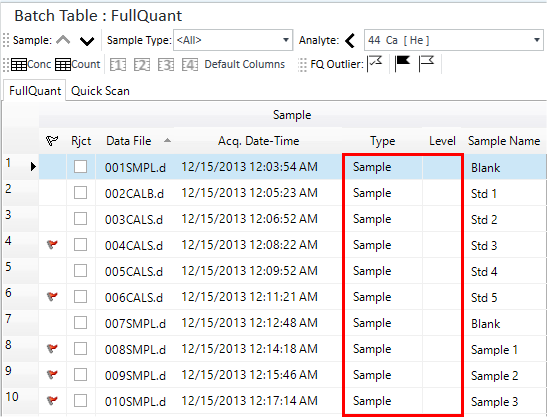
Batch Table Pane with Sample Information
The [Import All Samples from Batch] dialog box is displayed.
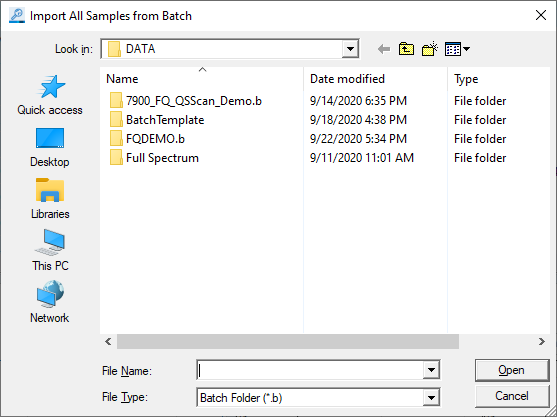
[Import All Samples from Batch] Dialog Box
Sample type setup
Specify the sample type and calibration curve level.
This screen shot shows examples of sample types and calibration curve levels.
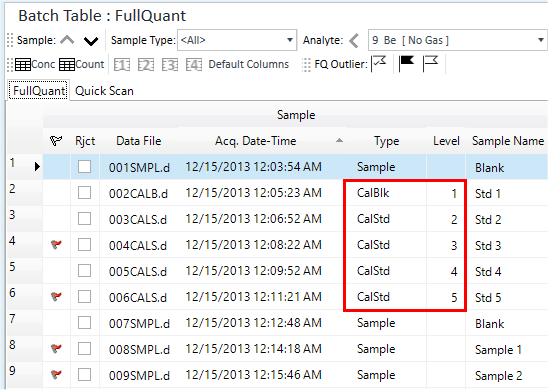
Batch Table Pane with sample types specified
Creating or Changing a Data Analysis method
Follow these steps to create or change a Data Analysis Method.
- Click [Edit] from the [Method] group on the [Home] tab.
The [Method Editor] window is displayed.

[Method Editor] Window
To edit the Data Analysis Method, execute the commands from the top of the Method Development Tasks pane, and set the necessary information is set in the pane on the right.
For more information about the parts and functions of the [Method Editor] window, refer to “[Method Editor] window”.
- You can import existing data analysis methods and/or standard data.
Follow these steps as necessary:
- To import a DA Method from a batch result:
Click [New] - [Import DA method only] from the [Method] group on the [Home] tab. The [Open Method] dialog box is displayed. Select a batch result.
- To import both the DA Method and the Standard Data from a batch
result:
Click [New] - [Import DA method and Standard Data] from the [Method] group on the [Home] tab. The [Open Method and Standard Data] dialog box is displayed. Select a batch result.
- To import the calibration curve data from the ChemStation:
Click [New] - [Import FQ Parameters from CS Cal] from the [Method] group on the [Home] tab.
The [Import FQ Parameters from CS Calibration] dialog box is displayed. Select a ChemStation calibration data file.
- To import a DA Method from a batch result:
- Create or change a Data
Analysis Method.
The procedures for creating or changing the Data Analysis Method vary depending on the Analysis Mode. For more information, refer to the following sections.
- “Creating a Data Analysis method for fullquant” under “Data Analysis for FullQuant Analysis”
- “Creating a Data Analysis method for semiquant” under “Data Analysis for SemiQuant Analysis”
- “Creating a data analysis method for isotope ratio analysis” under “Data Analysis for Isotope Ratio Analysis”
- “Creating a data analysis method for isotope dilution” under “Data Analysis for Isotope Dilution Analysis”
- “Creating a chromatogram data analysis method” under “Data Analysis for Chromatogram (Option)”
- “Analyzing data for Single Nanoparticle Analysis” under “Single Nanoparticle Application (Option)”
- On the Method
Development Tasks pane, click [Validate] in the Method
Development Tasks pane.
If an error is found in the Analysis Method, the error contents are displayed in the Method Error List pane. Correct the error.
If no error is found, a confirmation dialog box is displayed.
Confirmation Dialog Box
- Click <OK>.
- On the Method Development Tasks pane, click [Return to Batch-at-a-Glance] from the [Validate/Return] group.
- When asked whether to update the Data Analysis Method, click <Yes>.
Executing analyses
To do an analysis, follow these steps:
If analysis results don't exist for the batch, the [Process Batch] icon
changes to  .
.
- Click [Process Batch] from the [Batch Option] group on the [Home]
tab.
Analysis is performed using the settings in the Data Analysis Method, and the analysis results are displayed in the Batch Table pane.
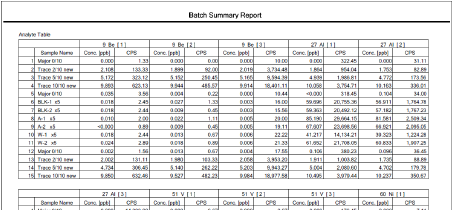
The results that are displayed depend on the type of analysis set in the Data Analysis Method. An example of FullQuant Analysis results is shown below.
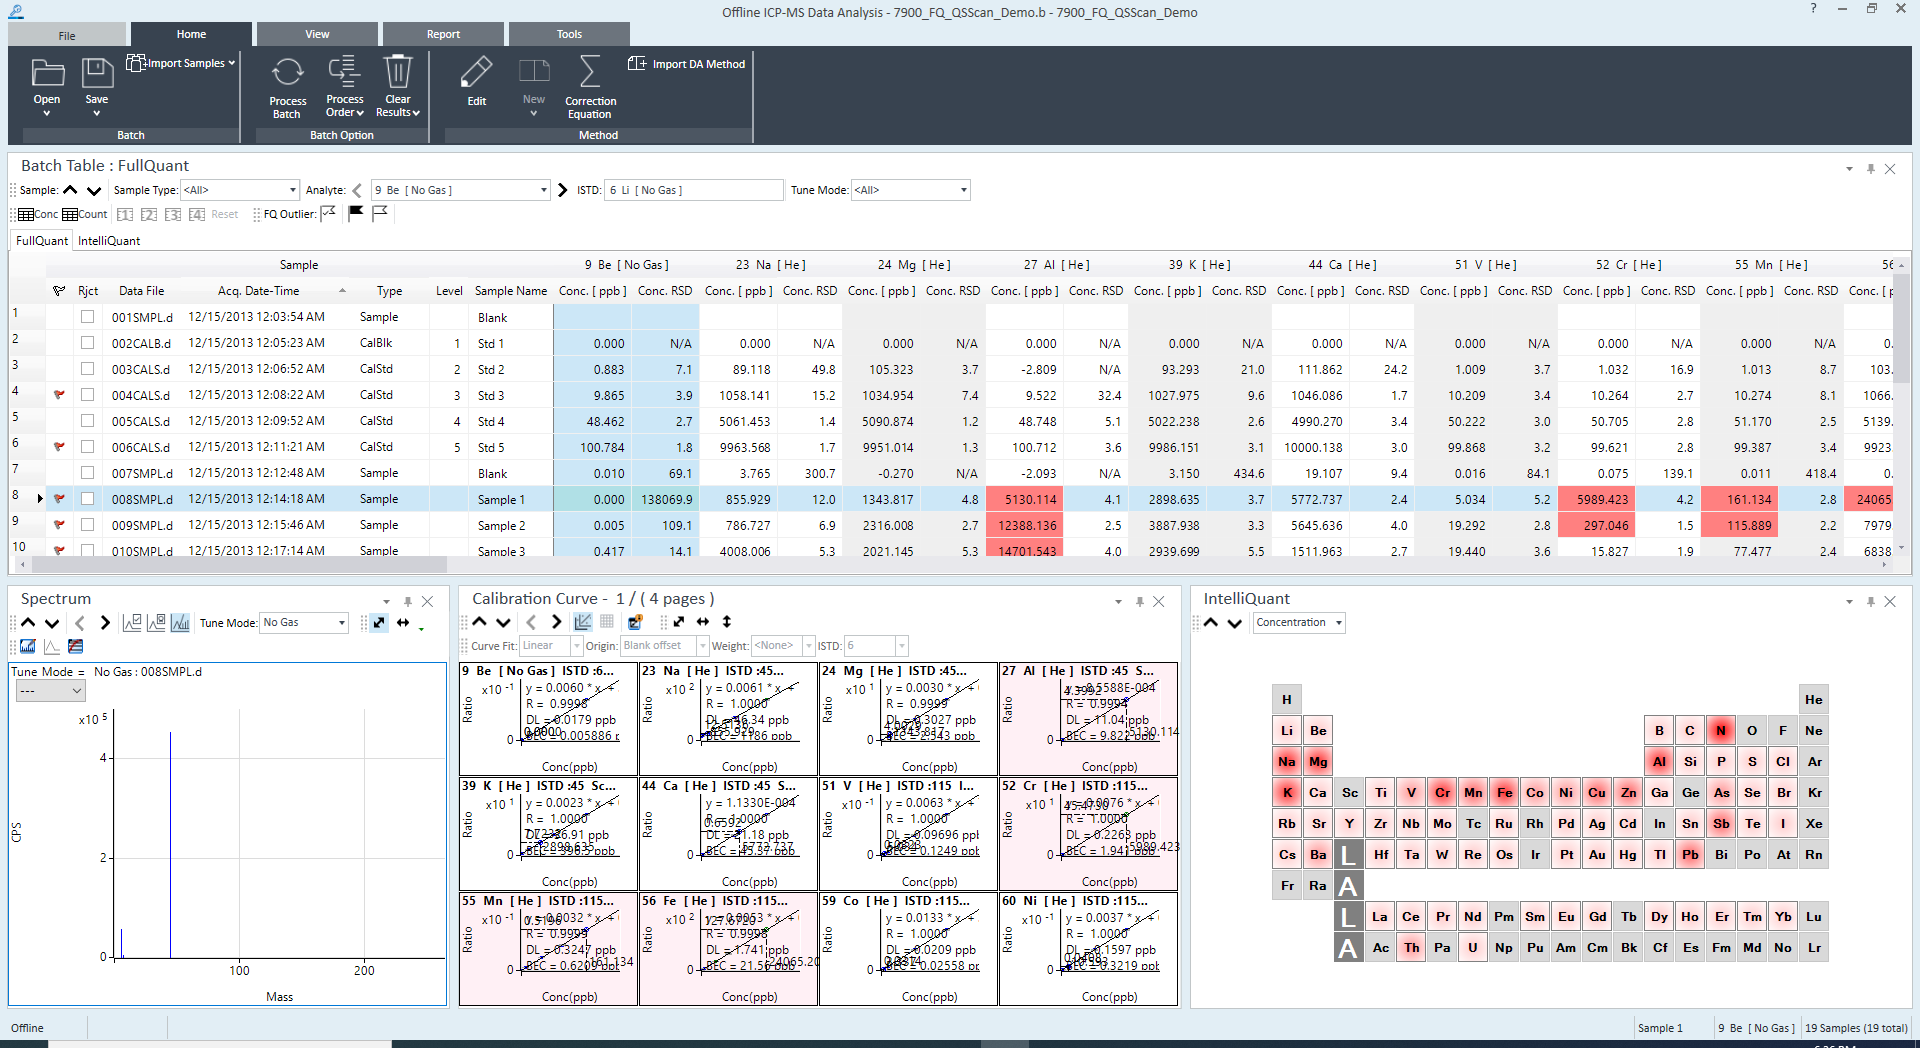
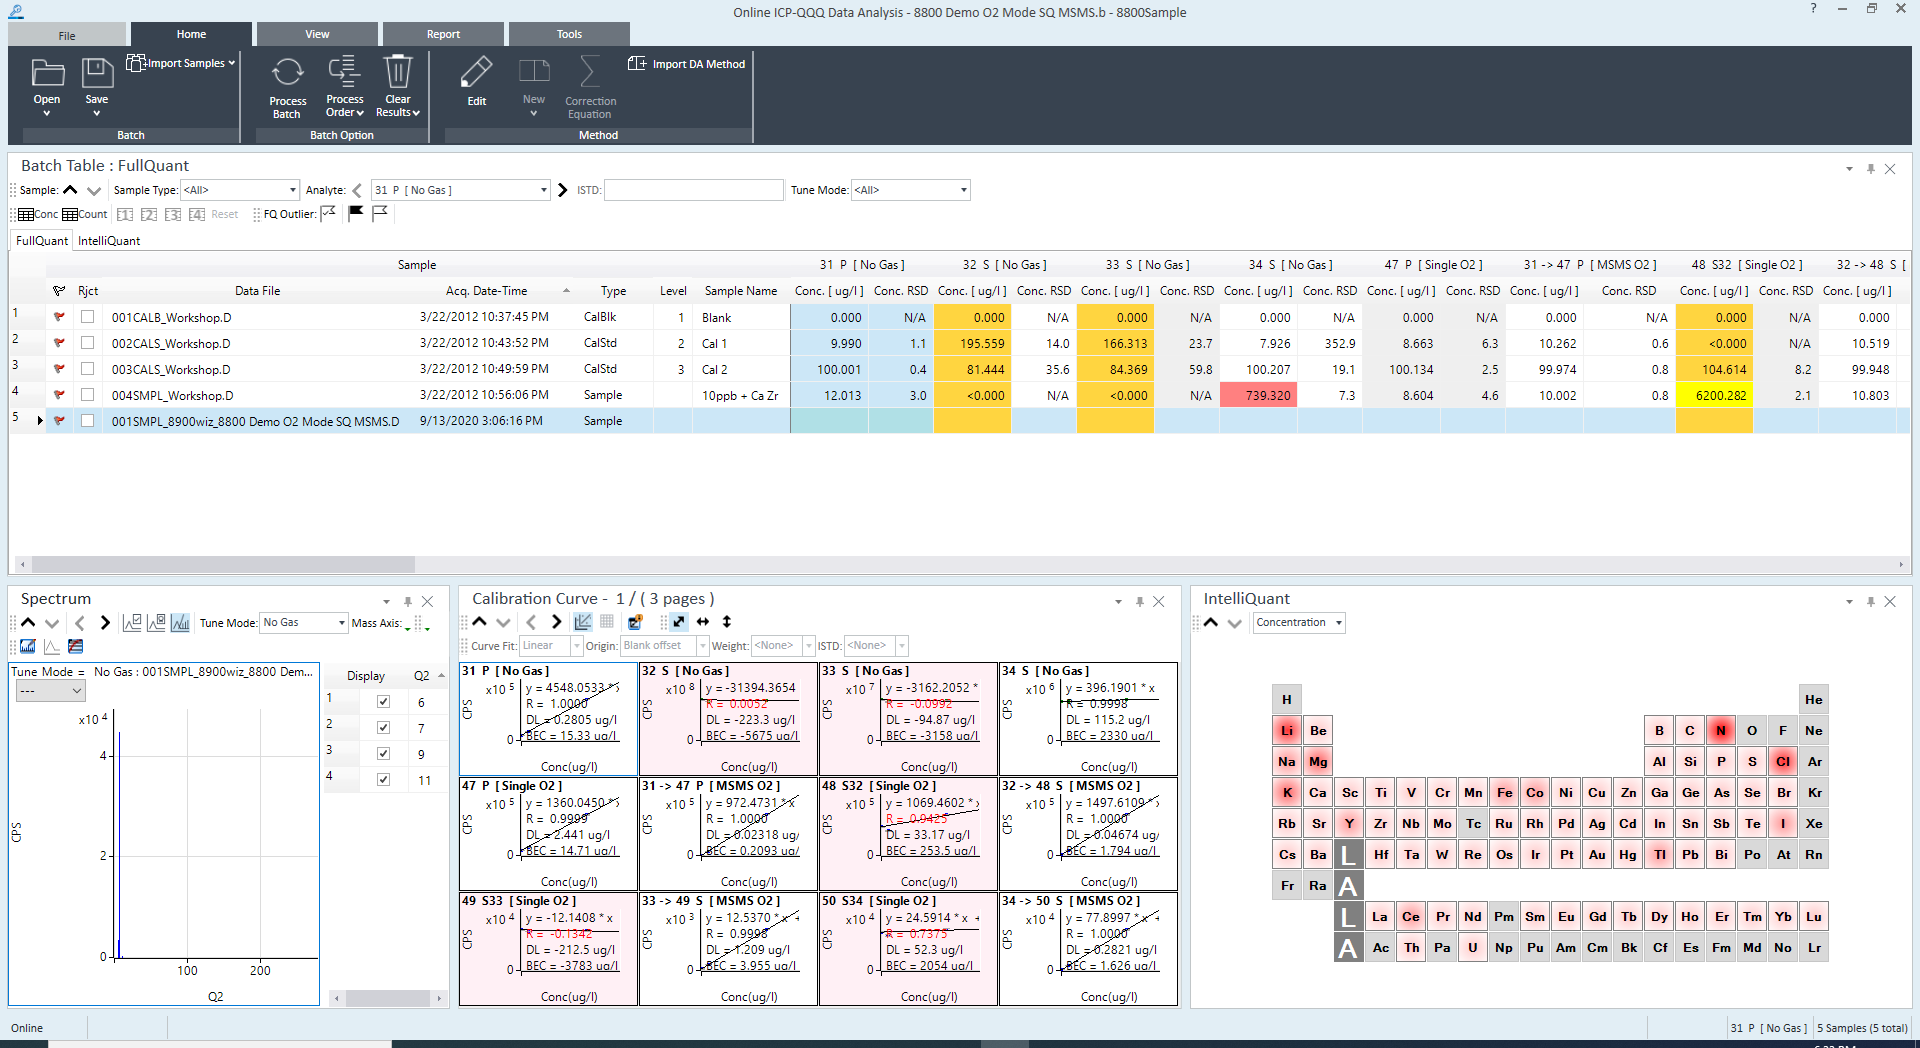
Analysis Results
Checking and correcting the analysis data
Check the analysis data, and make corrections as necessary.
The procedures for checking and correcting vary depending on the Data Analysis Method. For details, refer to the following sections.
- “Checking/Correcting the analysis results” under “Data Analysis for FullQuant Analysis”
- “Checking/Correcting the analysis results” under “Data Analysis for SemiQuant Analysis”
- “Checking/Correcting the analysis results for Isotope ratio analysis” under “Data Analysis for Isotope Ratio Analysis”
- “Checking/Correcting the analysis results for Isotope Dilution Analysis” under “Data Analysis for Isotope Dilution Analysis”
- “Checking the analysis results” under “Data Analysis for Chromatogram (Option)”
- “Analyzing data for Single Nanoparticle Analysis” under “Single Nanoparticle Application (Option)”
To clear the analysis results, click [Clear Results] - [Clear Results] from the [Batch Option] group on the [Home] tab.
If the data or the Data Analysis Method has been changed, redo the analysis.
If analysis results don't exist for the batch, the
[Process Batch] icon changes to .
Saving the analysis results
When data analysis is complete, save the Batch Result. To save the Batch Result, follow these steps:
- To overwrite: Click [Save] from the [Batch] group on the [Home] tab.
- To save with a different name: Select [Save] - [Save As] from the [Batch] group in the [Home] tab.
When is
displayed, the file cannot be saved. Click before saving.
When using ECM, OpenLab Server Products, Workstation Plus, or SDA, the displayed dialog box and the save file destination differ from standard MassHunter operations. For more information, refer to " Operations When Database Systems Are Used" in "Reference".
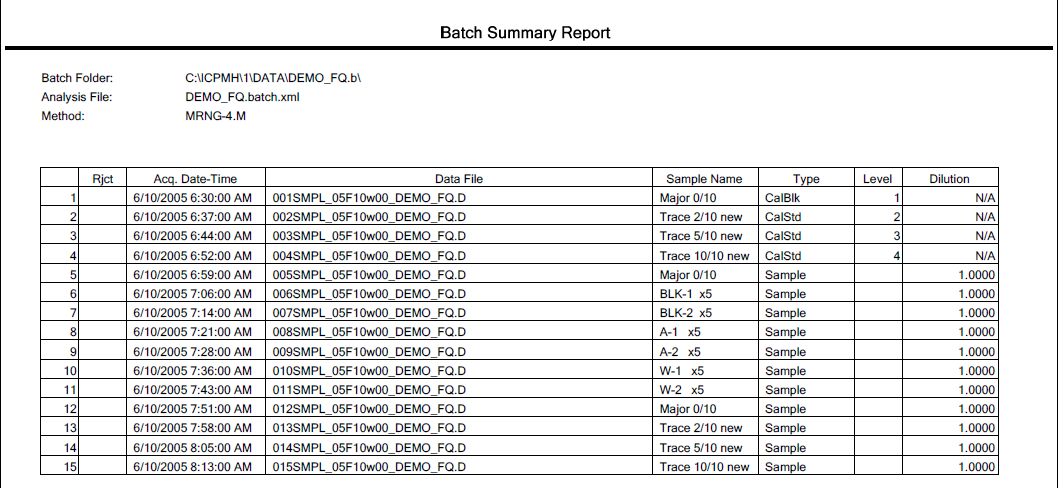
Generating the Quick Batch Report
You can print a printer-friendly summary of the FullQuant analysis results (Quick Batch Report).
Generating the Quick Batch Report
To print a Quick Batch Report, follow these steps:
- Click [Quick Batch Report] from the [Batch] group on the [Report]
tab.
The print preview pane is displayed.
- Click the [Print] button.
The Quick Batch Report is printed.
To select another column to print, click [Configuration] in “Quick Batch Report” from the [Reporting] category in the [Settings] dialog box.
Opens the [Configure Quick Batch Report] dialog box, which lets you select the columns that are displayed in the report.
This report prints on the Windows default printer.
Generating the analysis results report
You can generate an analysis results report using any of the following methods.
- Saving as a PDF file
- Printing from a printer
To generate an analysis results report, follow the steps below.
When is
displayed, the results report cannot be output. Click
before generating the report.
- Click the [Generate] from the [Samples] group on the [Report] tab.
The [Generate Report] dialog box is displayed.
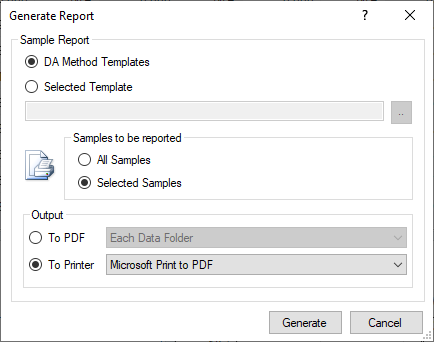
[Generate Report] Dialog Box
- Set the analysis results report type, the template to use, the
destination directory, and/or the printer.
For more information about these settings, refer to the help for the [Generate Report] dialog box.
- Click <Generate>.
The analysis results report is printed/saved.
Select [Queue Viewer] from the
 icon context
menu in the taskbar at the lower right corner of the screen.
icon context
menu in the taskbar at the lower right corner of the screen.The [Task Queue Viewer] dialog box appears and lets you view the progress of the print/save task.
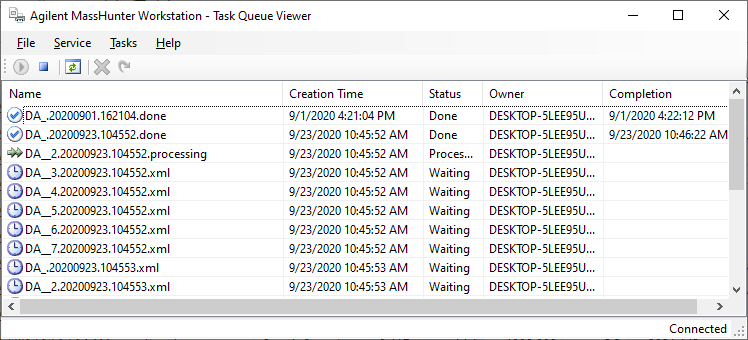
[Task Queue Viewer] Dialog Box
Displaying the Lab QC file
Measured values and graphs for QC samples can be displayed on a Lab QC file (Excel format).
It operates only when the Excel is installed.
If the optional Intelligent Sequence software is not installed, data for QC1, QC2, and QC5 is displayed on the respective sheet of the Lab QC file.
If the Intelligent Sequence software is installed, all samples are available for selection, but you may only select up to 3 types simultaneously. Use the “Lab QC” column on the [QC Configuration] windowto select the samples.
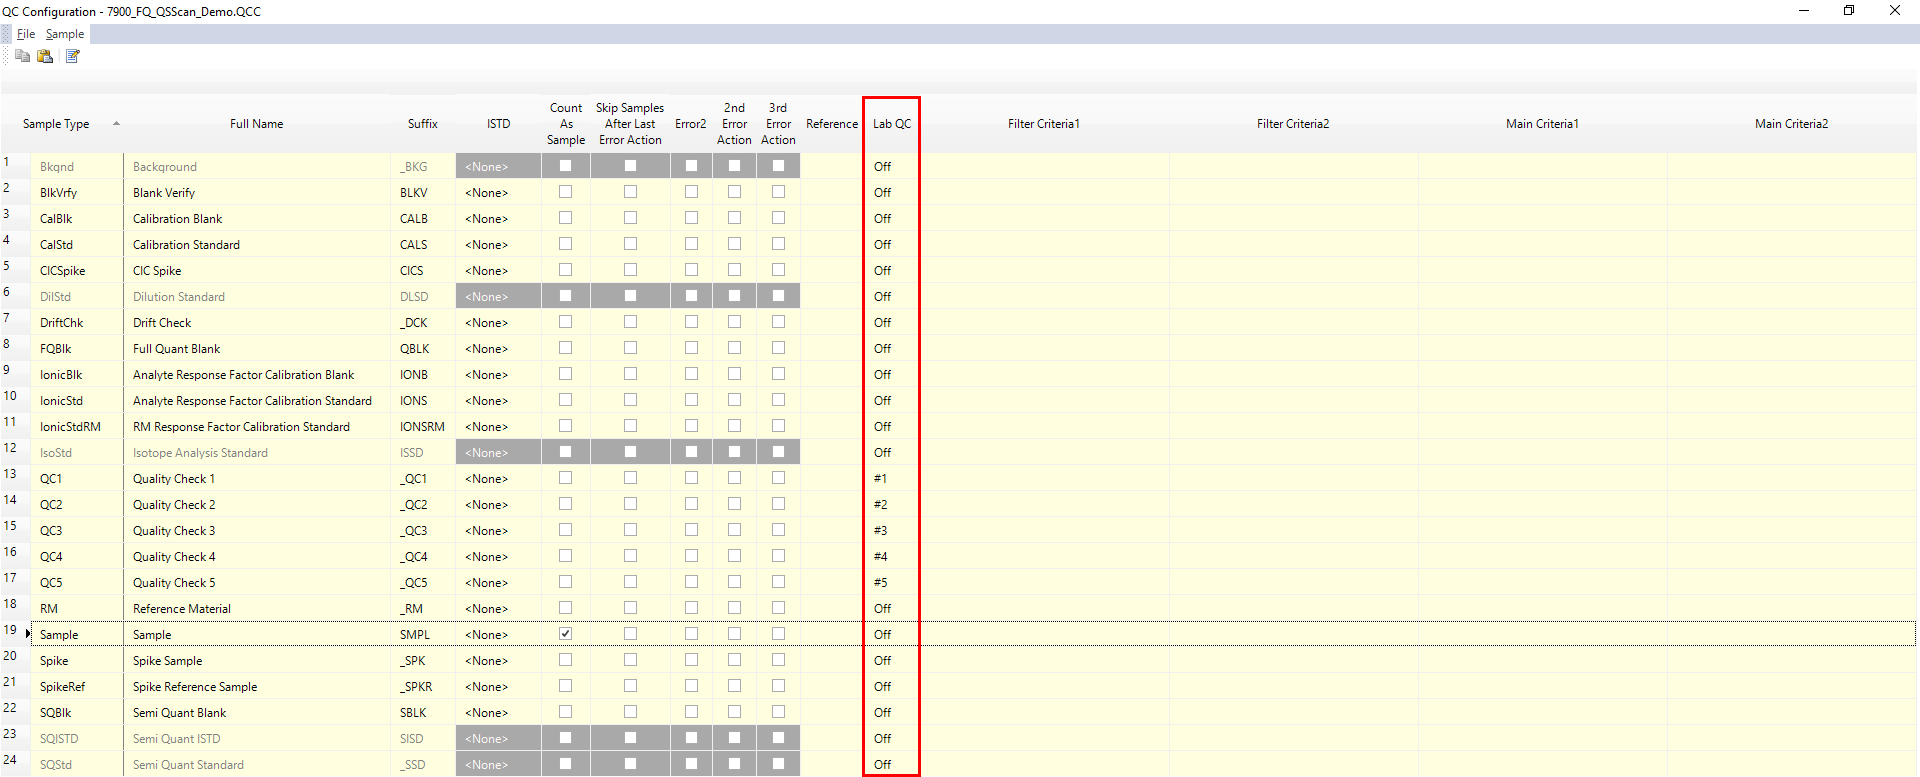
QC Configuration Window
To display the Lab QC file, complete the following steps:
- Click [Settings] from the [Settings] group on the [Tools] tab.
[Settings] dialog box appears.
- Click [Update] in “Lab
QC” from the [Reporting] category.
The [Update Lab QC File] dialog box is displayed.
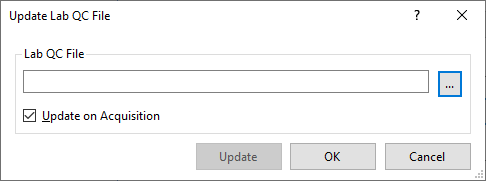
Update Lab QC File Dialog Box
- Click [...] to display the [Select Lab QC File] dialog box. Select the Lab QC file (Excel format) to display.
- To update data automatically, select [Update on Acquisition] on
the Update Lab QC File
dialog box, and click [OK].
To update manually, click [Update].
The selected Lab QC file (Excel format) opens.
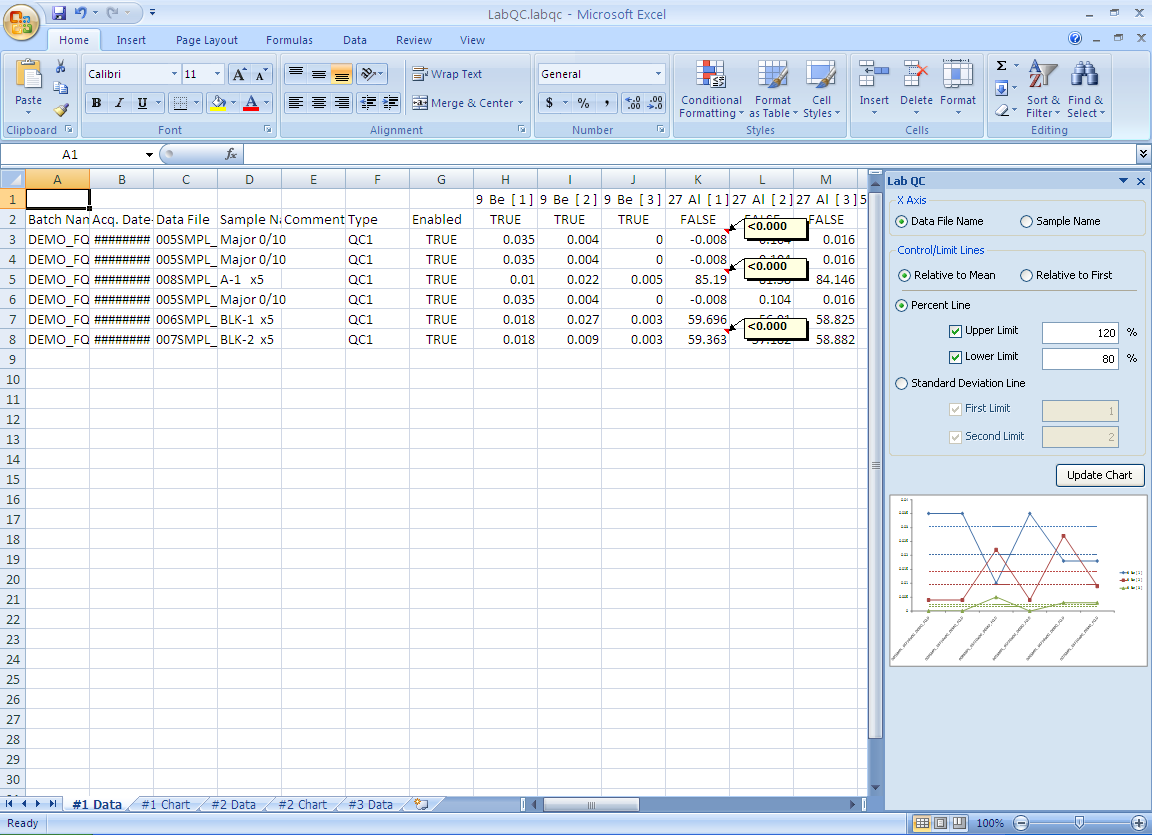
Lab QC File (Excel Format)
To create a new file, type the desired filename in the File Name field on the [Select Lab QC File] dialog box.
To display a graph on the right side of the Excel sheet, enter “TRUE” in the “Enabled” column of the desired sample. Enter “FALSE” for samples to exclude from the graph.
Closing the Data Analysis window
When done, close the [ICP-MSICP-QQQ Data Analysis] window. To close the [ICP-MSICP-QQQ Data Analysis] window, use any one of the following methods to exit Mas sHu nter Workstation. Be sure to save any changes before you exit the program.
- Double-click the Control Box Menu in the upper left corner of the [ICP-MSICP-QQQ Data Analysis] window.
- Click the Control Box Menu and then click [Close] in the pop-up menu that appears.
- Click on the "close" button in the upper right corner of the [ICP-MSICP-QQQ Data Analysis] window.
- Click [Exit] on the [File] tab in the [ICP-MSICP-QQQ
Data Analysis] window.
When the message "Save changes you made to batch?" is displayed, click either of the following buttons.
[Yes]: Save the batch and close the [ICP-MSICP-QQQ Data Analysis] window.
[No]: Does not save the batch and close the [ICP-MSICP-QQQ Data Analysis] window.
[Cancel]: Return to the program.