Data Analysis for SemiQuant Analysis
Semiquantitative (SemiQuant) analysis is a method to determine the approximate concentration of all the elements in an unknown sample. Semiquantitative analysis does not require calibration curves and can use internal standards to correct the matrix effect.
To perform semiquantitative analysis using data that were acquired with MassHunter Workstation for the unknown sample, perform the analysis using a Data Analysis Method for semiquantitative analysis.
This section describes how to create a data analysis method for semiquantitative analysis, perform the analysis, and check the analysis results.
- Data Analysis Procedure
- Loading data into the batch folder
- Sample type setup
- Creating a Data Analysis method for semiquant
- Executing analyses
- Checking/Correcting the analysis results
- Saving the analysis results
- Generating the analysis results report
- Closing the Data Analysis window
Loading data into the batch folder
Open a Batch Folder, and load the data to be analyzed by completing the following steps.
You may also choose to load the data after you create the Data Analysis Method.
- In the [ICP-MSICP-QQQ
Data Analysis] window, open a Batch Folder.
For more information, refer to “Opening the Data Analysis window”, “Creating a batch folder”, and “Loading a batch result” under “Common Data Analysis Operations”.
- In the [ICP-MSICP-QQQ Data
Analysis] window, load the standard sample data, the background data,
and the unknown sample data.
For more information, refer to “Loading the data” under “Common Data Analysis Operations”.
The data files are displayed in the Batch Table pane.
Sample type setup
Specify the sample type.
- Check that the correct Sample
types are displayed in the Type column of the Batch
Table pane. If they are incorrect, change the setting.
- Background sample (for background subtraction): Bkgnd
- SQ standard sample (for SemiQuant factor correction): SQStd
- ISTD sample for SQ (for internal standard correction): SQISTD
- Unknown sample: Sample
Creating a Data Analysis method for semiquant
To create a Data Analysis Method for SemiQuant, follow these steps:
- Click [Edit] from the [Method] group on the [Home] tab.
The [Method Editor] window is displayed.

[Method Editor] Window
- On the Method
Development Tasks pane, click [Data Analysis Method] from the
[Set up Basic Information] group.
The Data Analysis Method pane is displayed.
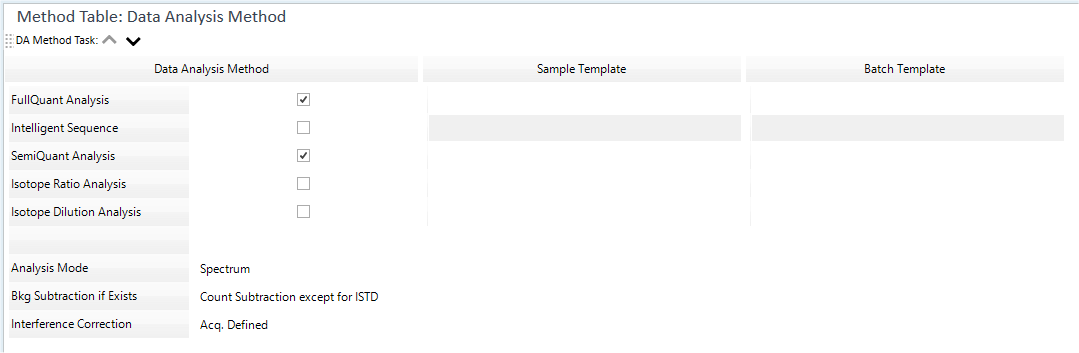
Data Analysis Method Pane
- Configure the settings in the Data
Analysis Method pane as follows:
Data Analysis Method Table
- Mark the check box for [SemiQuant Analysis].
- The [Analysis Mode] list displays the analysis mode for the
acquired data. The analysis mode can be changed.
Spectrum: Spectrum analysis mode (includes Multi Tune)
Timechart: Time resolved analysis mode or Time Program mode
Chromatogram: For details on the Chromatogram mode, refer to “Data Analysis for Chromatogram (Option)”.
- Select the background subtraction method from the [Bkg Subtraction
if Exists] list. This option is not displayed for Chromatogram
mode.
When [Bkg Subtraction if Exists] is checked, select “Bkgnd” for the sample type of the background sample.
- To perform interference correction:
Select the correction method from the [Interference Correction] list. This option is not displayed for Chromatogram mode.
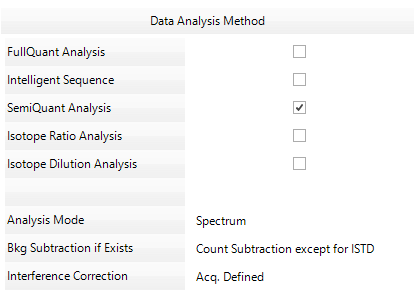
- In the Sample/Batch
Template table, configure the template for the analysis results
report.
There are two types of templates:
- Sample Template: Report of sample data
- Batch Template: Report of the entire batch
Click the
 on the right
end of the box to select a template, as necessary.
on the right
end of the box to select a template, as necessary.
Sample/Batch Template Table
The rows of the Sample/Batch Template table correspond to the rows of the Data Analysis Method table. Specify a template in the box on the same row of the selected Data Analysis Method.
For more information, refer to “Sample/Batch Template table”.
- On the Method
Development Tasks pane, click [SemiQuant] from the [Set up Analysis
Parameters] group.
The “SemiQuant pane” is displayed.
Select the data to use in the semiquantitative analysis.
Data
If the Quick Scan data has also been measured, select [Quick Scan]. Additionally, if you want to check each element's concentration and interference level calculated by IntelliQuant, select [IntelliQuant].
Tune Mode
Specify the tune mode for the data you want to use in the semiquantitative analysis. This column is not displayed if [Quick Scan] or [IntelliQuant] is selected since the tune mode to be used is determined uniquely.
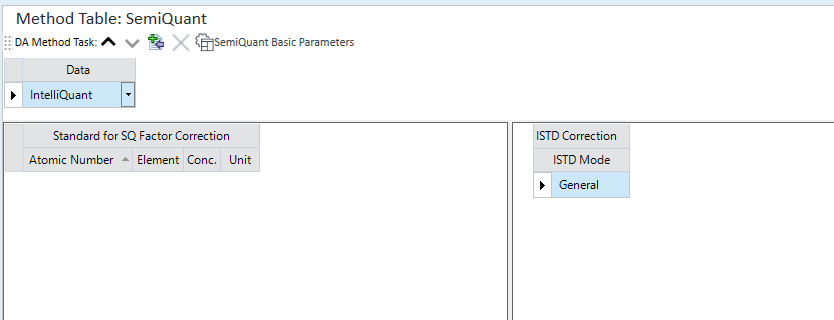
[SemiQuant] pane
Click
 .
. The [Elements] dialog box appears.
- Select the standard element for SemiQuant Factor Correction and
click [Add->].
The selected standard element is added to the [Select these elements] list.
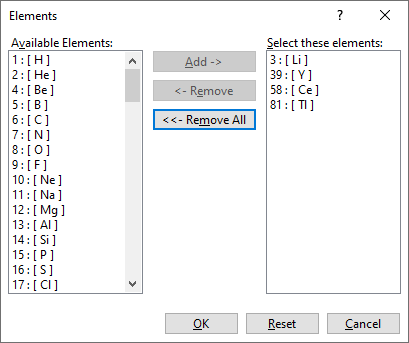
[Elements] dialog box
- After you select analytes, click <OK>.
The SemiQuant pane displays the standard elements for SemiQuant Factor Correction.
- In the SemiQuant
pane, set the concentration of the elements in the standard that
will be used for the SemiQuant factor correction.
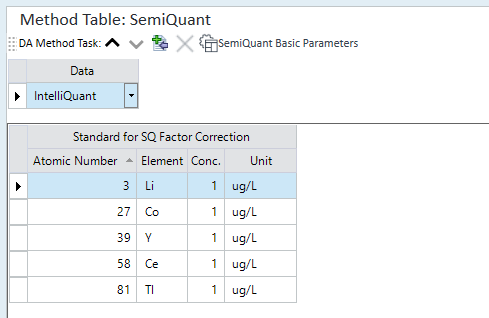
SemiQuant Pane
For more information on these settings, refer to “SemiQuant pane”.
- To specify the ISTD, right-click on the ISTD Correction Table and
select [Add/Remove ISTD Elements] from the context-menu.
The [Elements] dialog box appears.
- Set the element to use for the internal standard.
The ISTD element is set using the same procedure for adding a standard element.
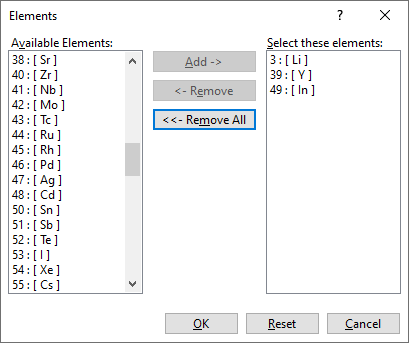
[Elements] dialog box
- After you select the ISTD elements, click [OK].
The ISTD elements appear in the ISTD Correction Table.
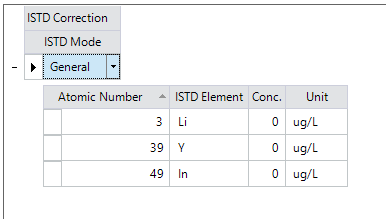
ISTD Correction Table
- If the ISTD mode is in Normal mode, set the concentration for the
ISTD elements.
For more information on these settings, refer to “ISTD Correction Table”.
- Configure the following settings as necessary:
- To set up a Worklist and configure custom actions and auto-saving
of analysis results report:
On the Method Development Tasks pane, click [Worklist Actions] from the [Advanced Info] group. The Work List Actions pane is displayed for setting up the Worklist.
For more information on these settings, refer to “Work List Actions pane”.
- To set up a Worklist and configure custom actions and auto-saving
of analysis results report:
- On the Method
Development Tasks pane, click [Validate] from the [Validate/Return]
group.
If an error is found in the Data Analysis Method, the error information is displayed in the Method Error List pane. Correct the error.
If no error is found, a confirmation dialog box is displayed.
Confirmation Dialog Box
- Click <OK>.
- On the Method Development Tasks pane, click [Return to Batch-at-a-Glance] from the [Validate/Return] group.
- When you are asked whether to update the Data
Analysis Method, click <Yes>.
Proceed to the analysis process.
“Spectrum” can be selected for data that was acquired in spectrum analysis mode. “Timechart” or “Chromatogram (Option)” can be selected for data that was acquired in Time Resolved analysis mode.
If not analyzed yet, all of these options can be selected. (Chromatogram is optional.)
For more information on these settings, refer to “Data Analysis Method table”.
Executing analyses
If a new Data Analysis Method was created or the settings were changed, perform an analysis. To perform an analysis, complete the following step:
- Click [Process Batch] from the [Batch Option] group on the [Home]
tab.
Analysis is performed using the settings in the Data Analysis Method, and the analysis results are displayed in the Batch Table pane.
Proceed to Checking/Correcting the analysis results.
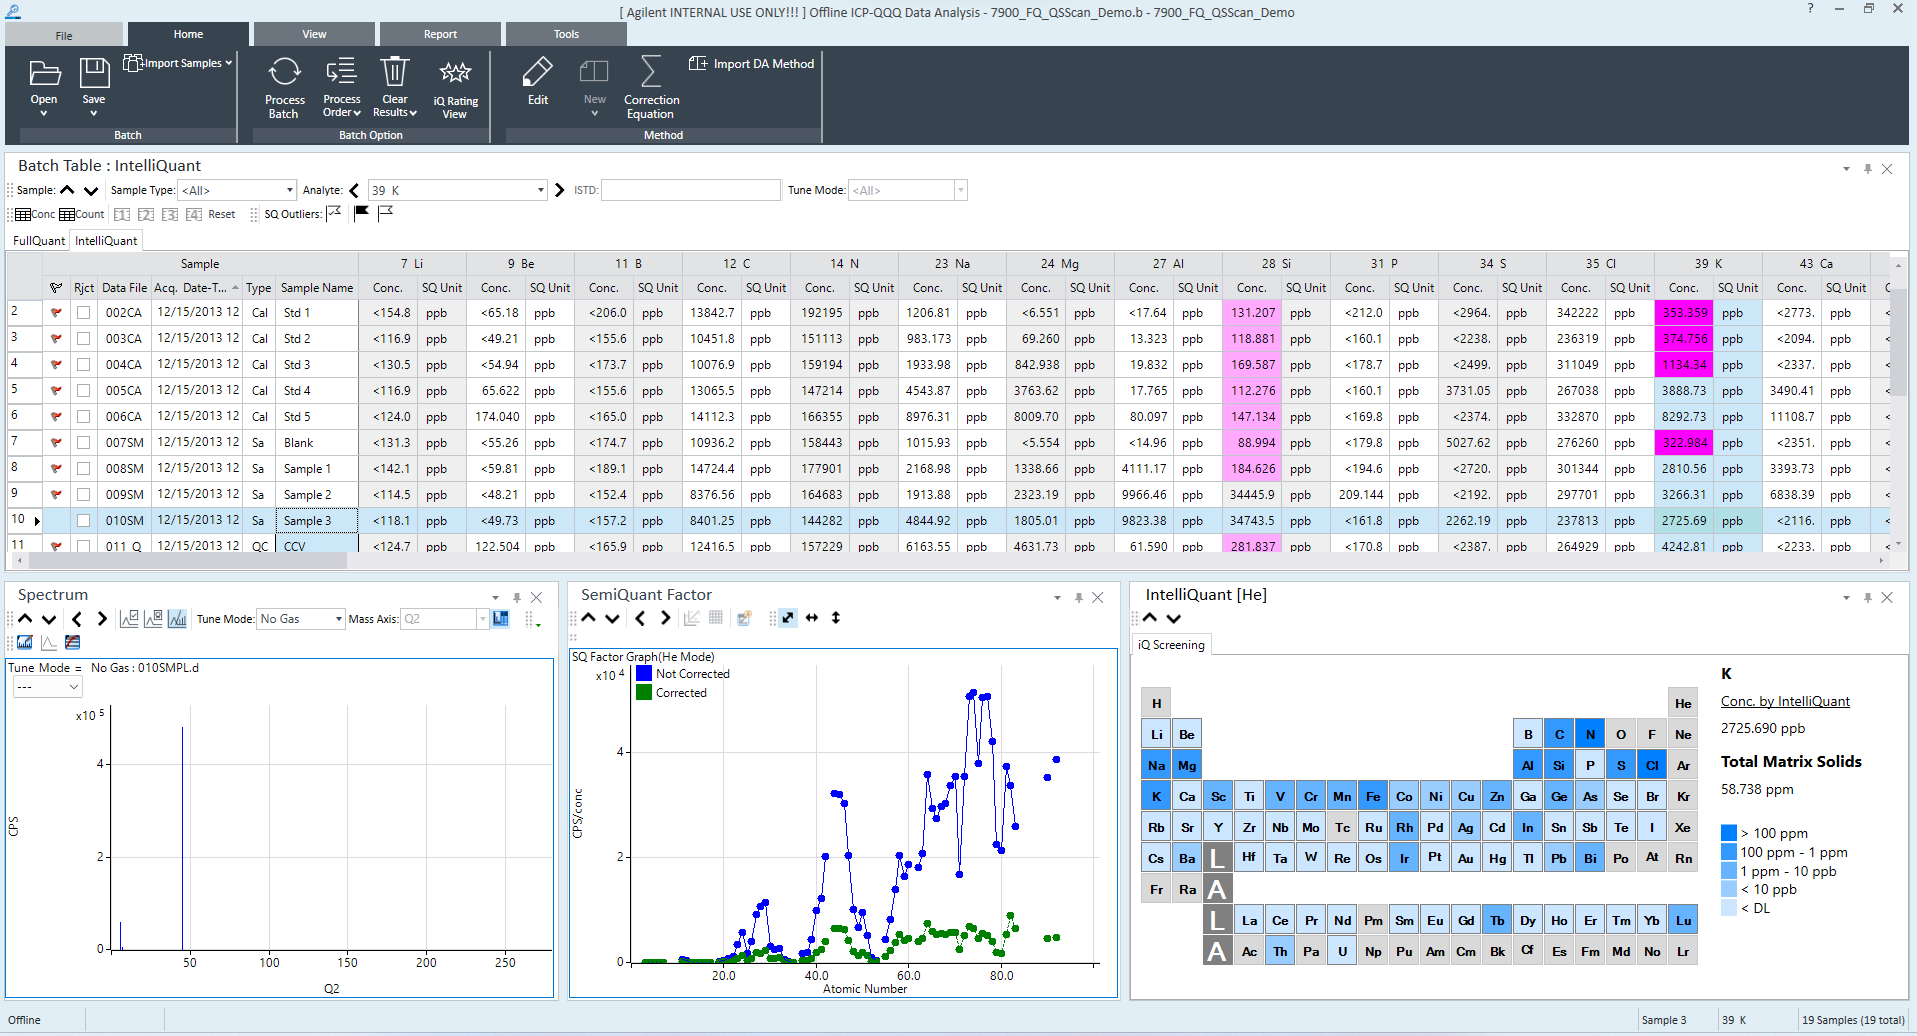
Analysis Results
Checking/Correcting the analysis results
This section describes the procedures for checking and correcting the semiquant analysis results.
- Checking the Batch Table pane
- Checking the spectrum pane
- Checking the timechart pane
- Checking the semiquant factor pane
- Checking the IntelliQuant pane
- Checking the ISTD stability graph pane
Checking the Batch Table pane
The Batch Table pane displays the concentration and count for each element in the samples. Various tools are provided that let you easily review the analysis results.
For more information on viewing and using the Batch Table pane, refer to “Batch Table Pane Operation”.
Checking the spectrum pane
If the Analysis Mode is “Spectrum”, the Spectrum pane is displayed.
For more information on viewing and using the Spectrum pane, refer to “Spectrum Pane Operation”.
Checking the timechart pane
If the Analysis Mode is “Timechart”, the Timechart pane is displayed.
For more information on viewing and using the Timechart pane, refer to “Timechart Pane Operation”.
Checking the semiquant factor pane
The SemiQuant Factor pane can be used to view the SemiQuant factor graphs. Place the cursor near a point on a graph to display element names and SemiQuant factor correction details as popups.
For information on viewing and using the SemiQuant Factor pane, refer to “SemiQuant Factor Pane Operations”.
For information on the SemiQuant factors, refer to “Adjusting the semiquant factors” under “SemiQuant Factor Pane Operations”.
For information on changing the SemiQuant factors, refer to “Changing the semiquant factors” under “SemiQuant Factor Pane Operations”.
Checking the IntelliQuant pane
For a semiquantitative analysis, the IntelliQuant pane is displayed when IntelliQuant is set to On.
In the IntelliQuant pane, you can check each element's concentration and interference level calculated by IntelliQuant in the periodic table.
For more information on viewing and using the IntelliQuant pane, refer to "IntelliQuant pane Operation".
Checking the ISTD stability graph pane
When you use internal standard correction, the recovery (%) of each ISTD element is displayed in the ISTD Stability Graph pane. If the recovery value is <100%, then the analysis results may be less reliable.
For information on viewing and using the ISTD Stability Graph pane, refer to “ISTD Stability Graph Pane Operation”.
Saving the analysis results
For more information, refer to “Saving the analysis results” under “Common Data Analysis Operations”.
Generating the analysis results report
For more information, refer to “Generating the analysis results report” under “Common Data Analysis Operations”.
Closing the Data Analysis window
For more information, refer to “Closing the Data Analysis window” under “Common Data Analysis Operations”.