IntelliQuant pane
This section describes the functions of the commands that are available on the IntelliQuant pane.
For more information, refer to "IntelliQuant pane Operation".
IntelliQuant pane
Title Bar
The title bar buttons and the context menu have the same functions as the Title Bar of the Instrument Status Pane.
IntelliQuant Toolbar

 Drag to move the toolbar.
 Displays
the periodic table for the previous sample.
Displays
the periodic table for the previous sample.
 Displays the periodic table for
the next sample.
Displays the periodic table for
the next sample.
Tab Functions
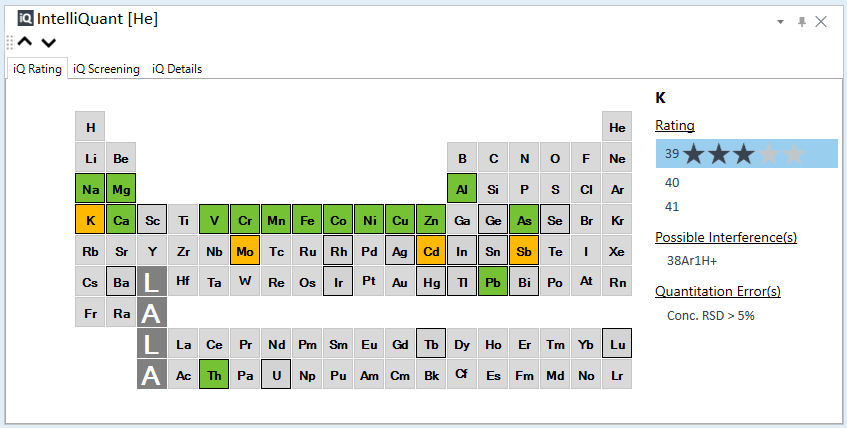
[iQ Rating] tab
You can check the interference level for each element.

Periodic Table
The colors indicate the interference level of each element.
Without frame: Elements not measured with FullQuant in the same tune mode as those measured by IntelliQuant.
With frame: Elements measured with FullQuant in the same tune mode as those measured by IntelliQuant.
The following explains the meaning of the colors inside the frames.
Gray: Elements that do not have isotopes with a rating of 1 or more. (No isotopes evaluated)
Yellow: Elements with isotopes with a rating of 1 to 3. (Not Good)
Green: Elements with at least one isotope with a rating of 4 or more. (Good)
Element symbol
Shows the Element for the currently selected element.
You can change the element by selecting the element in the periodic table or the element column in the Batch Table pane.
[Rating]
Shows the interference level rating of the currently selected element by isotope.
★★★★★: The mass cannot be identified by IntelliQuant (Rating 0)
★★★★★: Interference level > 100% (Rating 1) Not Good
★★★★★: Interference level 50 to 100% (Rating 2) Not Good
★★★★★: Interference level 20 to 50% (Rating 3) Not Good
★★★★★: Interference level 5 to 20% (Rating 4) Good
★★★★★: Interference level < 5% (Rating 5) Good
If the concentration of the FullQuant analysis is less than or equal to the limit of quantitation (=3.3 × DL), "concentration < LOQ" is displayed instead of the rating.
Only the mass number is displayed for isotopes that are not measured by FullQuant and are measured in the same tune mode as those in which quick scans are measured.
[Possible Interference(s)]
If IntelliQuant detects possible interference for the selected isotope, its chemical formula is listed. Otherwise, "Possible Interference(s)" is not displayed.
[Possible Elements]
If no single element can be determined, the isobars are displayed. Otherwise, "Possible Elements" is not displayed.
[Quantitation Error(s)]
If IntelliQuant detects an Error on the selected isotope, the error content is listed. Otherwise, " Quantitation Error(s)" is not displayed.
[iQ Screening] tab
You can check the concentration of the element calculated by IntelliQuant.
If this tab is not displayed, click [iQ Rating] in the [Batch Options] group on the [Home] tab.
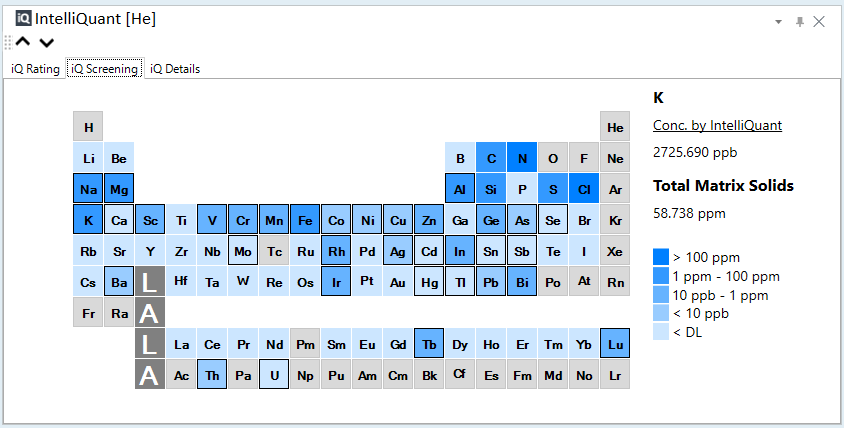
Periodic Table
Displays the IntelliQuant concentration of each element as a heat map.
See the legends on the bottom right for the correspondence between cell colors and concentrations. Gray: Elements not measured with Quick Scan.
With frame: Elements measured with FullQuant.
Element symbol
Shows the Element for the currently selected element.
You can change the element by selecting the element in the periodic table or the element column in the Batch Table pane.
[Conc. by IntelliQuant]
Shows the concentration of the currently selected element as calculated by IntelliQuant.
[Total Matrix Solids]
Shows the Total Matrix Solids (TMS) for the currently selected sample as calculated by IntelliQuant.
Legends
Shows the correspondence between the colors of the periodic table and the concentrations of elements.
[iQ Details] tab
You can check the concentration and raw CPS for each element and the abundance ratio (%) in a table.
If this tab is not displayed, click [iQ Rating] in the [Batch Options] group on the [Home] tab.
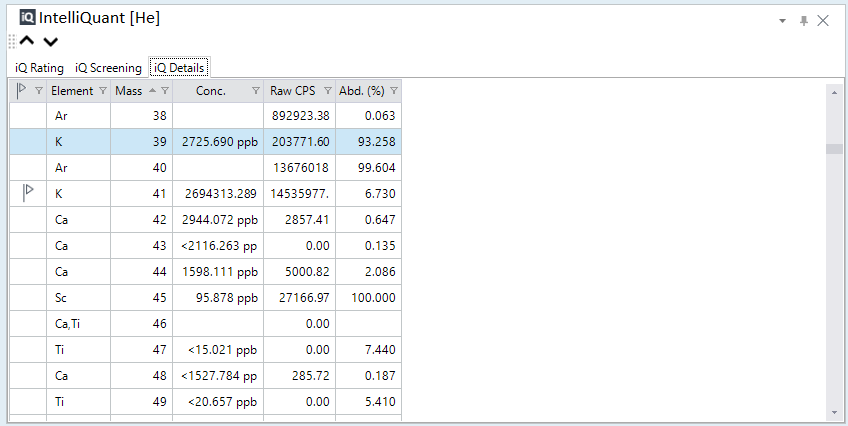
Column function
Each column header has a filter function.
[Flag] column
Icons are displayed for elements with Possible Interference(s) with a rating of 3 or less.
Hover the cursor over the icon to display information about Possible Interference(s) in a tooltip.
[Element] column
The element symbol of the element is determined by calculation based on the natural isotope ratio of the row’s mass number.
If no element is determined for the row's mass, the column is left blank.
If there are isobars and no single element can be determined, the element symbols of these isobars are displayed.
[Mass] column
Displays the mass number (2 to 260).
[Conc.] column
Displays the IntelliQuant concentration.
[Raw CPS] column
Displays the CPS measured by quick scan.
[Abd.(%)] column
Determines the Relative Isotopic Abundance (%) of the isotope of the element.
Context Menu
[Add/Remove Columns]
Opens the [Add/Remove Columns] dialog box, which lets you select the columns to display in the table.
[Reset]
Restores the default display settings for the table columns.
[Export Table]
Opens the [Export Table] (Entire Table) dialog box where you can export the entire table.
[Export Selected Area]
Opens the [Export Table] (Area) dialog box where you can export the data selected in the table.
[Copy]
Copies the selected data to the Clipboard.
If you have set the concentration units to "nmol / l", "umol / l", and "nmol / l" in the Calibration Pane, the IntelliQuant pane converts the concentration from mol-related units to ppb units.
To Get Here
- Open the SemiQuant analysis batch result in the [ICP-MSICP-QQQ Data Analysis] window.
- Select [Panes] - [IntelliQuant] from the [Show] group on the [View] tab in the [ICP-MSICP-QQQ Data Analysis] window, select [IntelliQuant] from [Data] in the SemiQuant Pane, and then update Data Analysis Method and return to Batch-at-a-Glance.