IntelliQuant pane Operation
This section describes the operation of the IntelliQuant pane. For the information about the functions of this pane, refer to "IntelliQuant pane". For more information about functions that are common to all panes, refer to "Common Pane Operations".

IntelliQuant pane
For a semiquantitative analysis, the IntelliQuant pane is displayed when IntelliQuant is set to On.
In the IntelliQuant pane, you can check each element's concentration and interference level calculated by IntelliQuant in the periodic table.
To display a different sample in the IntelliQuant pane, click one of the following icons on the IntelliQuant pane toolbar.
 Displays
the periodic table or data for the previous sample.
Displays
the periodic table or data for the previous sample.
 Displays the periodic table or
data for the next sample.
Displays the periodic table or
data for the next sample.
Tab Operations
The IntelliQuant pane has three tabs:
[iQ Rating] tab: You can check the interference level and Possible Interference(s) for each element.
[iQ Screening] tab: You can check the concentration of elements calculated by IntelliQuant.
[iQ Details] tab: You can check the concentration, raw CPS, and abundance ratio (%) of each element in a table.
[iQ Rating] tab
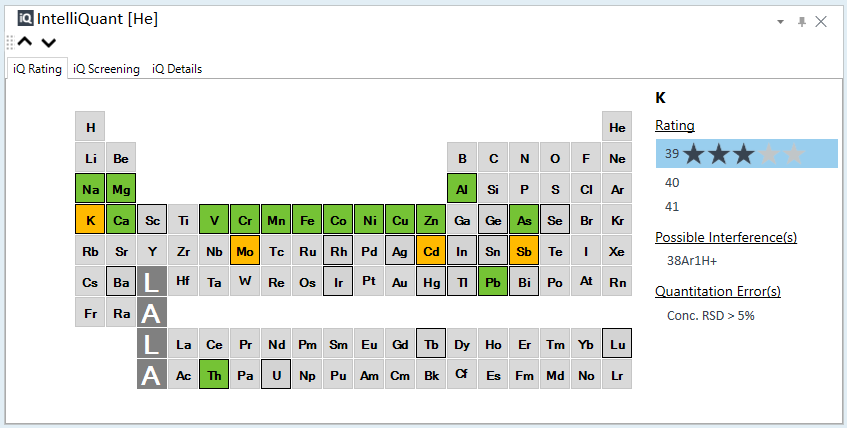
Check the rating of each element in the periodic table
Elements in green on the periodic table have a rating of 4 or higher, meaning there is high confidence in the results.
Elements in gray or yellow with a frame have a rating of 3 or less, meaning the results are less reliable.
Gray elements indicate that a reliability rating was not possible.
The rating is in five stages and is comprehensively judged based on the possibility of polyatomic ions interference, RSD, concentration, etc.
On this tab, check the following:
The right side of the periodic table shows the currently selected element and its isotope rating.
You can change the element by selecting the element in the periodic table or the element column in the Batch Table pane.
Check for possible interferences and quantitation errors
[Possible Interference(s)]: If IntelliQuant detects possible interference for the selected isotope, its chemical formula is listed.
[Possible Elements]: The isobars are displayed if no element can be determined.
[Quantitation Error(s)]: If IntelliQuant detects an Error for the selected isotope, the error content is listed.
[iQ Screening] tab
If this tab is not displayed, click [iQ Rating] in the [Batch Options] group on the [Home] tab.
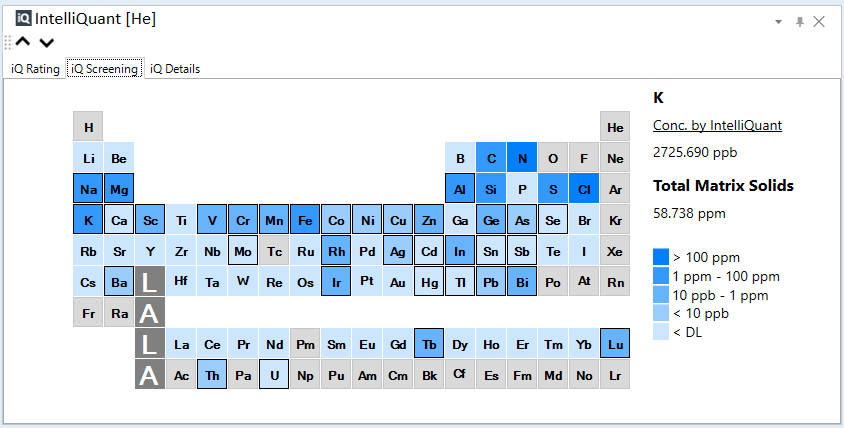
Check the concentration of each element in the periodic table
You can check the approximate concentration of each element contained in the currently selected sample on the periodic table.
See the legends on the bottom right for the correspondence between cell colors and concentrations.
Gray: Elements not measured with Quick Scan.
With frame: Elements measured with FullQuant.
Check the concentration of the currently selected element
The element symbol currently selected is displayed in the upper right.
The [Conc. by IntelliQuant] shows the concentration of the currently selected element as calculated by IntelliQuant.
You can change the element by selecting the element in the periodic table or the element column in the Batch Table pane.
Check the TMS of the currently selected sample
The [Total Matrix Solids] shows the Total Matrix Solids (TMS) for the currently selected sample as calculated by IntelliQuant.
[iQ Details] tab
If this tab is not displayed, click [iQ Rating] in the [Batch Options] group on the [Home] tab.
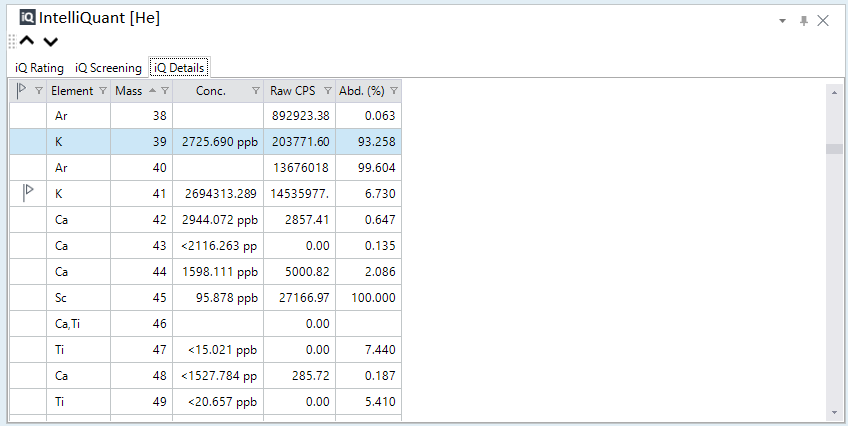
Filtering column data
Each column header has a filter function.
(All): Displays all data.
(Custom): Enter criteria to filter.
(Blanks): Shows only blank columns.
(NonBlanks): Shows columns that are not blank.
Data in Columns: Shows only columns of data that you select.
Column function
See the IntelliQuant pane for the function of each column.
Context Menu Function
Using the context menu, you can add/delete columns, export the table, etc.
See the IntelliQuant pane for context menu functions.