Calibration pane
Sets the analysis parameters when FullQuant Analysis is selected in the Data Analysis Method table.
For procedures on how to fill concentration and unit values for calibration curve levels, and to sort method tables, refer to the section on “Data Analysis Method Table Operation”.
For formulas see: Reference > Equations > Quantitation.
Method Toolbar

 Drag to move the toolbar.
 Displays
the settings for the previous basic method task.
Displays
the settings for the previous basic method task.
 Displays the settings for the next
basic method task.
Displays the settings for the next
basic method task.
 Displayed when the Analysis Mode is set to "Spectrum".
Displays the Advanced Calibration Setting view when this is set to ON.
Displayed when the Analysis Mode is set to "Spectrum".
Displays the Advanced Calibration Setting view when this is set to ON.
 Displays the [Autocalibration
Assistant] dialog box. You can automate the setup for the calibration
curve pane by setting the stock standard solution type and level dilution
factor.
Displays the [Autocalibration
Assistant] dialog box. You can automate the setup for the calibration
curve pane by setting the stock standard solution type and level dilution
factor.
 Replaces the analyte list for the Instrument
Control with the elements set in the Element
Selection Pane. Elements that are set only in this pane are deleted.
Elements that are not set in this pane are added.
Replaces the analyte list for the Instrument
Control with the elements set in the Element
Selection Pane. Elements that are set only in this pane are deleted.
Elements that are not set in this pane are added.
 For Data Analysts, displays the [Select
a Batch Folder for Analyte List] dialog box, which allows you to select
the Method file you want to use to load the Analyte List. For data acquired
with Multi Tune, displays a dialog box that allows you to select the Tune
Mode you want to load.
For Data Analysts, displays the [Select
a Batch Folder for Analyte List] dialog box, which allows you to select
the Method file you want to use to load the Analyte List. For data acquired
with Multi Tune, displays a dialog box that allows you to select the Tune
Mode you want to load.
 Displays when [Advanced Calibration Setup]
is set to ON. Displays the [Select
a Data File for Analyte List] dialog box, which allows you to select
the data file to use to load the Analyte List. For data acquired with
Multi Tune, displays a dialog box that allows you to select the Tune Mode
you want to load.
Displays when [Advanced Calibration Setup]
is set to ON. Displays the [Select
a Data File for Analyte List] dialog box, which allows you to select
the data file to use to load the Analyte List. For data acquired with
Multi Tune, displays a dialog box that allows you to select the Tune Mode
you want to load.
 Displays when [Advanced Calibration Setup]
is set to ON. Adds a new analyte. The analyte is added to the end row
of the table.
Displays when [Advanced Calibration Setup]
is set to ON. Adds a new analyte. The analyte is added to the end row
of the table.
 Deletes the selected element. If [Advanced
Calibration Settings] is set to OFF, all Analyte / ISTD elements with
the same "Name" are removed, regardless of their mass.
Deletes the selected element. If [Advanced
Calibration Settings] is set to OFF, all Analyte / ISTD elements with
the same "Name" are removed, regardless of their mass.
 Displays the [Add/Remove
Columns] dialog box, which allows you to select the columns displayed
in the Analyte table.
Displays the [Add/Remove
Columns] dialog box, which allows you to select the columns displayed
in the Analyte table.
Context Menu
This section describes the commands that are available in the context menu that is displayed by right-clicking in the pane. The commands that are not listed below have the same function as their counterparts on the toolbars and the Ribbon.
[Add/Remove Columns]
Opens the [Add/Remove Columns] dialog box, which lets you select the columns to display in the Analyte table.
[Reset]
Restores the default display settings for the table columns.
[Export Table]
Opens the [Export Table] (Entire Table) dialog box where you can export the entire table. This command is available when a pane that includes a table is selected.
[Export Selected Area]
Opens the [Export Table] (Area) dialog box where you can export the data selected in the table. This command is available when a range of cells in the table is selected.
[Copy]
Copies the selected data to the Clipboard. When a graphics pane is selected, the graphics will be copied.
[Paste]
Pastes the data copied with the Copy command.
[Add Levels]
[1]~[5]
Adds a selected number of calibration curve levels from the list.
[Delete Level]
Deletes the selected calibration curve level.
[Delete]
Deletes the selected data. This command is available when a cell in an editable table is selected.
[Reset Sort]
Restores the default sorting order on a tabular pane.
[Lock Analyte Columns]
Locks or unlocks the Analyte Columns for reference while you scroll the Calibration Pane horizontally.
[Fill Down]
When this command is executed after you select multiple cells vertically, the value in the first cell is copied to the selected cells.
[Fill Across]
When this command is executed after you select multiple cells horizontally, the value in the first cell is copied to the selected cells.
[Multiply Conc]
When this command is executed after you select a calibration Level cell (for example: selecting a cell in the column under Level 1 (or selecting the entire column), right-clicking and then clicking on this command), the [Multiply Conc] dialog box opens.
For more information, see “Multiply the concentration of calibration curve levels” under “Data Analysis Method Table Operation”.
[Page Setup]
Opens the [Page Setup] dialog box where you can configure the page settings for printing.
[Print]
Opens the [Print] dialog box where you can print the contents of the selected pane.
[Print Preview]
Opens the [Print Preview] dialog box where you can display the print preview.
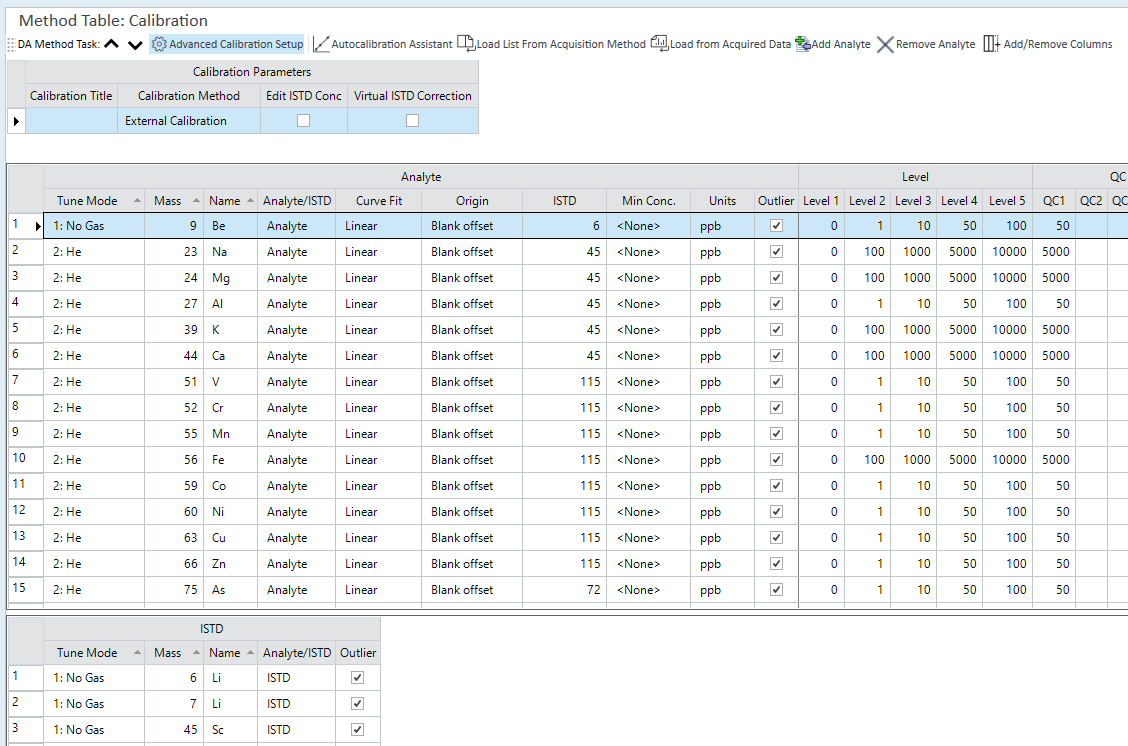
Calibration Parameters Table
Displays when [Advanced Calibration Setup] is on.
Calibration Title
Lets you enter a title for the calibration curve.
Calibration Method
Lets you select the Method for the calibration curve.
Edit ISTD Conc
Select to change the ISTD concentration. Select to show the ISTD Conc setting column.
Virtual ISTD Correction
Select to perform VIS correction. Select to show the Virtual ISTD Correction and VIS Flag setting columns.
The VIS correction is not supported for an MS/MS scan. It is supported only for a Single Quad scan.
VIS Interpolation Fit
Select the VIS correction type from the list.
- Point-to-Point: Applies linear interpolation to the data of two VIS elements (no extrapolation). Requires one or more VIS elements.
- Linear: Determines a linear formula for the data of all VIS elements. Requires two or more VIS elements.
- Quadratic: Determines a quadratic formula for the data of all VIS elements. Requires three or more VIS elements.
The VIS correction is not supported for an MS/MS scan. It is supported only for a Single Quad scan.
CIC
This function is available only with the optional Chromatographic Analysis software installed. Use this function to quantitate a desired peak using the calibration curve of another peak. When selected, the substitution setting column is displayed in the analysis target's table.
Global CIC
This function is only available when the optional Chromatographic Analysis software is installed. This column is displayed when [CIC] is selected. Click the right side of the column to display the dialog box for specifying compounds. In this dialog box, you can specify which compound's calibration curve is used in each EIC for a compound that has no calibration curve settings. Having no calibration curve settings means that the [Level] column of the calibration curve is blank and the [Substitution] column shows <None>.
Analyte Table
Tune Mode
Displays when [Advanced Calibration Setup] is on.
Displays the Tune Mode.
Mass
Displays when [Advanced Calibration Setup] is on.
Displays the mass.
Atomic Number
Displays the atomic number.
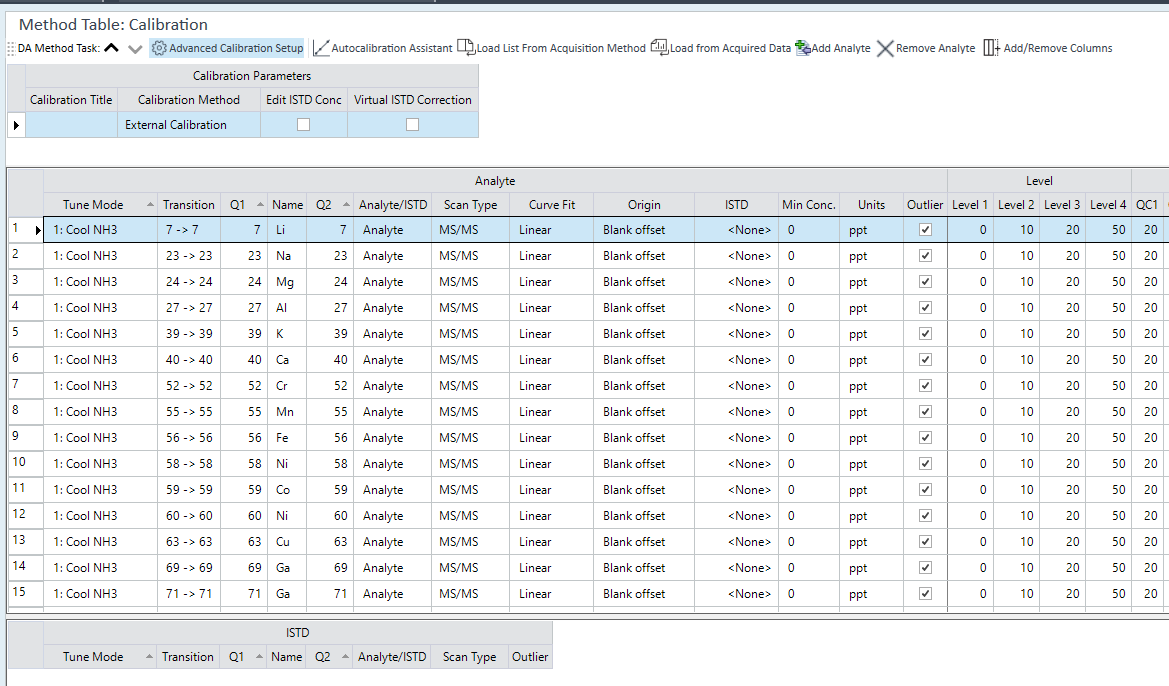
Transition
Displays when [Advanced Calibration Setup] is on.
Displays the transition of masses when [Scan Type] is [MS/MS].
Q1
Displays when [Advanced Calibration Setup] is on.
Displays the masses of Q1 when [Scan Type] is [MS/MS].
Name
Displays the analyte name.
Analyte/ISTD
Lets you select Analyte or ISTD from the list.
Q2
Displays when Advanced Calibration Setup is on.
Displays the masses of Q2.
RT
This function is available only with the optional Chromatographic Analysis software installed. The retention time is displayed.
Curve Fit
Lets you select the Curve Fit.
Origin
Lets you select the Origin.
Weight
Lets you select the Calibration curve weighting formula.
ISTD
Lets you select the element to use as the ISTD.
Min Conc
Lets you enter the minimum concentration.
Units
Select one of the following units for the concentration.
- ppm
- ppb
- ppt
- ug/ml
- ng/ml
- pg/ml
- mg/l
- ug/l
- ng/l
- mg/kg
- ug/kg
- ug/g
Outlier
Specifies whether to perform the outlier check for each element. By default, the setting is on and the outlier check is performed. The results of the outlier check are displayed in the batch table.
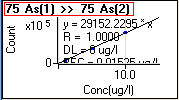
Substitution
This function is available only with the optional Chromatographic Analysis software installed. Select the mass that substitutes for the calibration curve or select [Spike]. If you select [Spike], another peak is used as the substitution for the calibration curve. Specify the peak name for each level in the [Spike Compound] column.
The setting can be confirmed on the Calibration Curve pane. When As(1) is analyzed using the calibration curve for As(2), the Calibration Curve pane indicates this as shown below. If the calibration curve has been substituted, you cannot change it here. To change the calibration curve, make the change on the original substituted curve. For more information, refer to “Changing the calibration curve settings”.
Quant by Height
This function is available only with the optional Chromatographic Analysis software installed. Select the check box to quantitate by peak height. Otherwise, quantitation is performed by peak area.
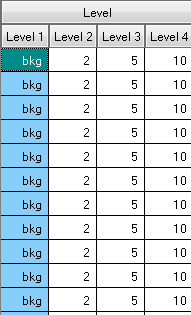
Level
Enter the concentration of each calibration curve level.
When using “Standard Addition” as the Calibration Curve, you can input “bkg” in the Level 1 column to use the measured concentration of the background data for Level 1.
For Level 2 and higher, input the concentration of the added standard solution.
The following types of background solutions are generally used:
Ultrapure water used as background for the instrument
Blank solution used for sample adjustment
Spike Compound
This function is available only with the optional Chromatographic Analysis software installed. When [Spike] is selected in the [Substitution] column, you can select the peak name for each level.3
QC
Enter the concentration of the QC sample.
Blank
Enter the concentration of the blank.
Spike Amount
When using Spike as the Sample Type, enter the Spike Amount
ISTD Table
Tune Mode
Displays when [Advanced Calibration Setup] is on.
Displays the Tune Mode.
Mass
Displays when [Advanced Calibration Setup] is on.
Displays the mass.
Atomic Number
Displays the atomic number.
Transition
Displays when [Advanced Calibration Setup] is on.
Displays the transition of masses when [Scan Type] is [MS/MS].
Q1
Displays when [Advanced Calibration Setup] is on.
Displays the masses of Q1 when [Scan Type] is [MS/MS].
Name
Displays the analyte name.
Analyte/ISTD
Lets you select Analyte or ISTD from the list.
Q2
Displays when [Advanced Calibration Setup] is on.
Displays the masses of Q2.
VIS Flag
Mark the check box for the ISTD element to perform VIS correction on.
The VIS correction is not supported for an MS/MS scan. It is supported only for a Single Quad scan.
Units
Lets you select one of the following units of concentration.
- ppm
- ppb
- ppt
- ug/ml
- ng/ml
- pg/ml
- mg/l
- ug/l
- ng/l
- mg/kg
- ug/kg
- ug/g
Outlier
Specifies whether to perform the outlier check for each element. By default, the setting is on and the outlier check is performed. The results of the outlier check are displayed in the batch table.
Level
Enter the concentration for the ISTD level.
Height
This function is only available with the optional Chromatographic Analysis software installed. Displays the peak height.
Area
This function is only available with the optional Chromatographic Analysis software installed. Displays the peak area.
Quant by Height
This function is only available with the optional Chromatographic Analysis software installed. Select this to quantitate by peak height. Otherwise, quantitation is performed by peak area.
Time Reference Flag
This function is only available with the optional Chromatographic Analysis software installed. Select this to specify the time reference compound.
If compound B is a time reference for compound A, the Retention Time (RT) of A’s peaks will be multiplied by the ratio of the actual-to-expected RT of B’s primary hit peak.
This is useful when the target compound’s RT drifts and the related ISTD used as the time reference also experiences the same relative shift.
To Get Here
- When [FullQuant Analysis] is set to On in the [Data Analysis Method] table, click [FullQuant] from the [Set up Analysis Parameters] group in the Method Development Tasks pane.
- Click [Calibration] from the [Acquisition] group in the Task Navigator.