Data Analysis Method pane
Lets you make basic settings for the data analysis method, and set the template to use for the analysis report.
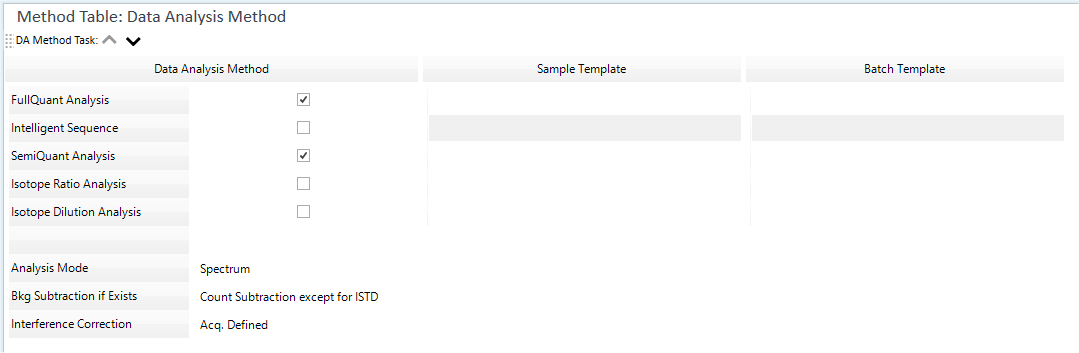
Data Analysis Method table
Lets you make basic settings for the data analysis method.
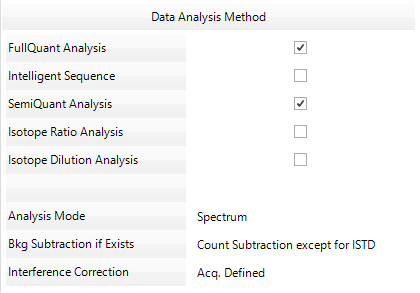
FullQuant Analysis
Select to perform quantitative analysis.
Intelligent Sequence
Select to perform quantitative analysis using the optional Intelligent Sequence software.
SemiQuant Analysis
Select to perform semiquantitative analysis.
Isotope Ratio Analysis
Select to perform isotope ratio analysis.
Isotope Dilution Analysis
Select to perform isotope dilution analysis.
Analysis Mode
Select the Analysis Mode from the list.
- Spectrum
- Timechart
- Chromatogram (Option)
Bkg Subtraction if Exists
Select the subtraction method to use for background subtraction. When the Analysis Mode is chromatographic analysis, select the check box to subtract the background spectrum from the sample spectrum. When Background Subtraction is selected, the abundance value of each mass in the background spectrum is subtracted from the abundance value of the corresponding mass in the sample spectrum. Background subtraction is performed automatically for samples of type "Bkgnd" in the Batch Table pane.
- Count Subtraction for All: Subtracts the count for all elements.
- Count Subtraction except for ISTD: Subtracts the count for all elements except for ISTD elements.
- Ratio to ISTD Subtraction: Uses the ISTD ratio to determine the value subtracted for each element.
Interference Correction
Select the interference correction method from the list.
- Acq. Defined: Use the interference correction method from the acquisition data.
- <None>: Do not perform interference correction
- REE++ Correction
- EnvNoORS.ITE: Library for general environmental analysis (for non-ORS models)
- EnvORS.ITE: Library for general environmental analysis (for ORS models)
- EPA200_8.ITE: Library for EPA200.8
- EPA6020.ITE: Library for EPA6020
- FoodORS.ITE: Library for food analysis (for ORS models)
Point to Point Count Correction
This item appears when the Analysis Mode is Chromatogram mode. If the "Point-to-Point Count Correction" is ON, when samples whose sample type is NOT the CalBlk are processed, each data point count of each mass is corrected by the following equation:
[Count of each mass at each spectrum] * [online ISTD count in CalBlk / online ISTD count in sample].
The CalBlk sample means most recent CalBlk to the sample in process order.
When the check box is selected, the [Online ISTD] column is added in the Peak List Table on the Integration Parameters Pane, which lets you enter the masses for ISTD to use in the correction.
To perform the count correction properly, the integration time must be the same between the CalBlk sample and sample to be corrected. This is normally the case, since the CalBlk and sample in a batch are acquired with the same method.
If your system has an LC connected to the ICP-MSICP-QQQ and it is set up to deliver ISTD continuously, then the signal of the ISTD should remain constant. If you notice some drift in the ISTD signal, it may be due to the condition of the instrument or some effect of the sample. To cancel those effects, you can use Online ISTD to correct the signals of the target ions.
Sample/Batch Template table
Sets the sample template and batch template to be used for the analysis report output.
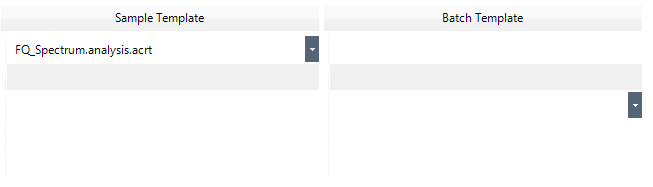
There are two types of templates:
- Sample Template: Report of sample data
- Batch Template: Report of the entire batch
![]() select the template
to use from each list.
select the template
to use from each list.
The following templates can be set to the analysis method.
- <None>: No template is selected for the analysis method.
- <Quick Batch Report>: Selects the Quick Batch Report for the analysis method for the batch report. For report details, refer to “Generating the Quick Batch Report” under “Common Data Analysis Operations”.
- <Reference>: Lets you select a saved template for the analysis method report.
For information on the type of templates provided, refer to “Template Types”.
The rows of the Sample/Batch Template table correspond to the rows of the Data Analysis Method table. Specify a template in the box on the same row of the selected Data Analysis Method.
You can select Report Templates (*.analysis.acrt) created in the Report Designer or Excel Report Templates (*.xltx、*.xltm).
However, you can select the Excel Report Template only when the Excel is installed.
Each Report Template is stored in each of the following paths:
Report Designer:\Agilent\ICPMH\Report Templates\CRE\en
To create a new Report Template (*.analysis.acrt) in the Report Designer, click [Open Designer] from the [Reporting] category in the [Settings] dialog box. For more information, refer to “Editing Report Templates”. Then you can specify the new template in the Sample/Batch Template table.
Template Types
This section describes the types of templates provided.
Report template name |
Usage |
|
|---|---|---|
Quantitative Analysis |
FQ_Spectrum.analysis.acrt |
Sample report for a spectrum analysis |
FQ_TRA.analysis.acrt |
Sample report for a time resolved analysis |
|
Method_Spectrum.analysis.acrt |
Method report for a spectrum analysis |
|
Method_Chromatogram.analysis.acrt |
Method report for a chromatogram analysis |
|
Method_Timechart.analysis.acrt |
Method report for a time resolved analysis |
|
Semiquantitative Analysis |
SQ.analysis.acrt |
Sample report for a semiquantitative analysis |
IR.analysis.acrt |
Sample report for an isotope ratio analysis |
|
ID.analysis.acrt |
Sample report for an isotope dilution analysis |
|
Single Particle Analysis |
SP.analysis.acrt |
Sample report for a single particle analysis |
The item “data analysis method” has been added to the sample report template. You can output the batch results and the data analysis method to one sample report.
The sample report templates for USP<232> and ICH Q3D analysis are stored on the system disc.
Destination path: \Report Templates\CRE\en\
Report template name: USP232_ICHQ3D.analysis.acrt
To Get Here
- Click [Data Analysis Method] from the [Set up Basic Information] group in the Method Development Tasks pane.