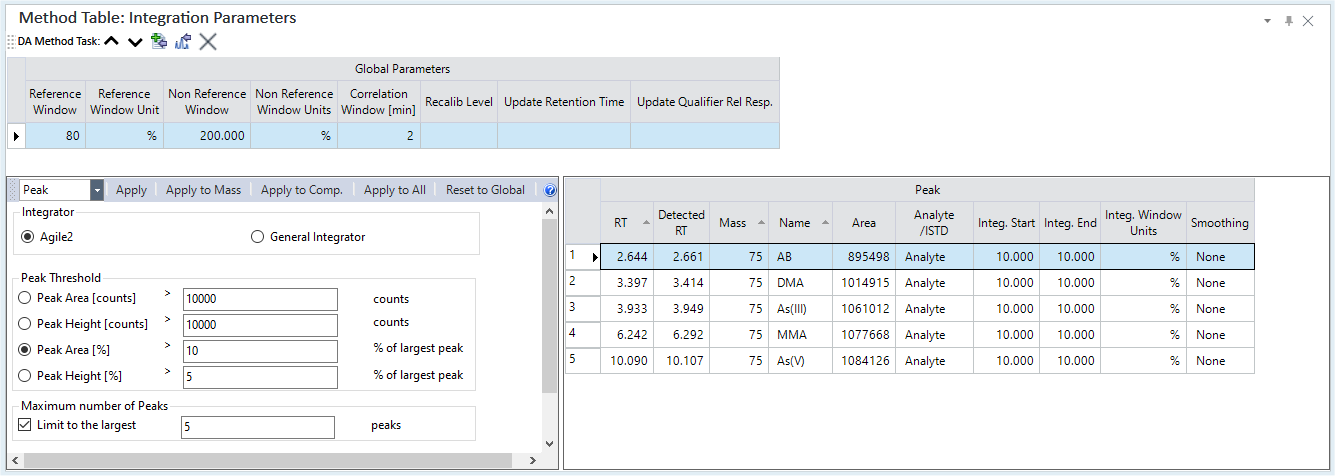
Integration Parameters Pane
Sets the chromatogram-related parameters when the Analysis Mode is set to “Chromatogram (Option)” in the Data Analysis Method table. The Chromatogram pane (Method Editor) is also displayed.
- Method Toolbar
- Context Menu
- Global Parameters Table
- Peak List Table
- Integration Parameters Table
- To Get Here
Method Toolbar
 Drag to move the toolbar.
 Displays
to the settings for the previous basic method task.
Displays
to the settings for the previous basic method task.
 Displays to the settings for the
next basic method task.
Displays to the settings for the
next basic method task.
![]() Adds a new
analyte to the end row of the table.
Adds a new
analyte to the end row of the table.
![]() A column
for the peak group is added in the Peak List table. If you click the Include
column, the [Select
Peaks to Include] dialog box appears, which lets you set the
peaks to group.
A column
for the peak group is added in the Peak List table. If you click the Include
column, the [Select
Peaks to Include] dialog box appears, which lets you set the
peaks to group.
 Deletes the selected element.
Context Menu
This section describes the commands that are available in the context menu that is displayed when you right-click in the pane. The commands that are not listed below have the same function as their counterparts on the toolbars and the Ribbon.
[Shift Retention Time]
The [Shift Retention Time] dialog box is displayed, which lets you shift the retention time (RT) for all analytes.
[Add/Remove Columns]
Opens the [Add/Remove Columns] dialog box, which lets you select the columns to display in the Peak List table.
[Reset]
Restores the default display settings for the table columns.
[Export Table]
Opens the [Export Table] (Entire Table) dialog box where you can export the entire table. This command is available when a pane that includes a table is selected.
[Export Selected Area]
Opens the [Export Table] (Area) dialog box where you can export the data selected in the table. This command is available when a range of cells in the table is selected.
[Copy]
Copies the selected data to the Clipboard. When a tabular pane is selected, the selected row/column is copied.
[Paste]
Pastes the data copied with the Copy command.
[Reset Sort]
Restores the default sorting order on a tabular pane.
[Fill Down]
When this command is executed after you have selected multiple cells vertically, the value in the first cell is copied to the selected cells.
[Fill Across]
When this command is executed after you have selected multiple cells horizontally, with the value in the first cell is copied to the selected cells.
[Page Setup]
Opens the [Page Setup] dialog box where you can configure the page settings for printing.
[Print]
Opens the [Print] dialog box where you can print the contents of the selected pane.
[Print Preview]
Opens the [Print Preview] dialog box where you can display the print preview.
Global Parameters Table
Lets you set global parameters to update the calibration curve from a sequence. For normal analyses, this setting is not used.
Reference Window
Specify the range that is allowed for the retention time of internal standard elements.
A FullQuant analysis will not be done on analytes that use internal standard elements whose peak retention times are outside this range. Specify a wide range if the retention time of the internal standard element changes across samples.
Set the unit in [Reference Window Unit].
Reference Window Unit
Sets the unit for the width of the Reference Window.
- min
- %
Non Reference Window
Specify the range that is allowed for the retention time of analytes. For normal analysis, this setting is not used.
A FullQuant analysis will not be done on analytes if the retention time of the analyte peak is outside this range. Specify a wide range if the retention time of the analyte changes across samples. Set the unit in Non Reference Window Units.
Non Reference Window Units
Select the unit for Non Reference Window from the list.
- min
- %
Correlation Window
Sets the range that the retention times of the target and qualifier can be different.
Recalib Level
Lets you select the calibration curve level to use to recalibrate the relative response for retention times and qualifiers using a standard sample while executing a sequence.
Update Retention Time
Sets the update method for the retention time.
- No update: Updates are not performed.
- Average: Calculates the average of the retention time set for [RT] in the peak list table and the standard sample retention time set in the [Recalib Level] and applies it to subsequent samples.
- Replace : Replaces the retention time set for [RT] in the peak list table with the standard sample retention time set in the [Recalib Level], and applies it to subsequent samples.
Update Qualifier Rel Resp.
Sets the update method for the relative response of the qualifier ion.
- No update: Updates are not performed.
- Replace : Replaces the qualifier relative response set for [Relative Response] in the peak list table with the qualifier relative response measured using the standard set in the [Recalib Level], and applies it to subsequent samples.
Peak List Table
When a peak row is selected in this table, the corresponding peak is highlighted in the Chromatogram pane (Method Editor).
RT
Enter the retention time.
The RT for all analytes can be shifted if necessary, such as when a column ages. Right-click on the pane and select [Shift Retention Time] from the context menu, then enter the shift value in the [Shift Retention Time] dialog box. The values in each RT column in each row are updated.
Detected RT
Displays the retention time found during autointegration.
Mass
Enter the mass.
Scan Type
Lets you select a scan type.
Q1
Lets you select the masses of Q1 when [Scan Type] is [MS/MS].
Name
Lets you enter the analyte name.
Q2
Set the masses of Q2.
Area
Displays the peak area.
Height
Displays the peak height.
Analyte/ISTD
Select Analyte or ISTD from the list.
Target/Qualifier
Select Target or Qualifier Ion from the list.
[Target]: Ion used to construct a calibration curve and perform quantitative analysis.
[Qualifier]: Ion that is used to calculate the ratio of the Target ion.
Integ. Start
Specifies where to stop automatic integration of a peak, using the units set in Integ. Start Units.
Integ. End
Specify the area for automatic integration. This item sets the range on the right hand side of the peak. Set the unit in Integ. End Units.
Integ. Window Units
Sets the unit for Integ. Start and Integ. End.
Smoothing
If there are peaks with noise on the surface, there may be a problem with the integrator. In this situation, try selecting [Gaussian] to perform Gaussian smoothing to integrate it properly.
Qualifier
If you select [Qualifier] from [Target/Qualifier], select the mass to use for the qualifier.
Rel Resp.
Specify the expected value of the qualifier ratio (the relative ratio of the qualifier to the target) in %.
Int. Parms.
When the integration parameters of the peaks are changed from global integration parameters on the Integration Parameters Table, "Custom" is displayed. For a blank, global integration parameters are set.
Sum Peaks in Integ Window
If there are several peaks in the integration range, marking this item causes the sum of those peaks to be calculated and used as the area and height for the target element. Assuming that the sensitivity of like elements are similar, this allows a FullQuant analysis to be done on several peaks that are grouped into one.
However, the peaks are not added for sample types CalBlk or CalStd.
Online ISTD
To perform a count correction for each acquisition point, enter the masses for ISTD to use in the correction.
Noise Alg.
Lets you select an algorithm to use for noise calculation. Note: this column is not displayed by default. To use this column, you must add it through [Add/Remove Columns] in the context menu.
[RMS]: RMS value of the noise
[Peak To Peak]: Difference between the maximum and minimum values
Manual Integ.
A check mark indicates that the peak was calculated using manual integration.
This column is not displayed by default. To use this column, you must add it through [Add/Remove Columns] in the context menu.
Criteria
Lets you select the criteria for each peak.
[Close RT]: Regardless of the qualifier ratio or signal quality, use the peak that has the closest retention time (RT).
[Close RT with Qualifiers]: Among the peaks within the acceptable range of qualifier ratios, use the peak that has the closest retention time (RT).
[Greatest Response]: Use the peak with the largest response, measured in either the height or area. To use heights to detect a peak, select the [Quantitate by Height] column in the Calibration pane.
[Greatest Q-Value]: Use the peak with the largest Q value of the qualifier.
This column is not displayed by default. To use this column, you must add it through [Add/Remove Columns] in the context menu.
Exclude
If you click this item when [Peak Sum] is selected in the [Peak Type] column, the [Select Peaks to Exclude] dialog box appears, which lets you select the peaks to remove from the peak sum.
This column is not displayed by default. To use this column, you must add it through [Add/Remove Columns] in the context menu.
Include
If you click this item when [Peak Group] is selected in the [Peak Type] column, the [Select Peaks to Include] dialog box appears. You can select the peaks to include in the peak group.
This column is not displayed by default. To use this column, you must add it through [Add/Remove Columns] in the context menu.
Peak Type
You can select a peak type.
[Single]: Single peak
[Peak Group]: Peak group
[Peak Sum]: Peak sum
This item can be selected when an area is set by clicking ![]() in the toolbar on the Chromatogram
pane.
in the toolbar on the Chromatogram
pane.
[Area Sum]: Area sum
This item can be selected when an area is set by clicking ![]() in the toolbar on the Chromatogram
pane.
in the toolbar on the Chromatogram
pane.
This column is not displayed by default. To use this column, you must add it through [Add/Remove Columns] in the context menu.
Transition
Displays the transition of masses when [Scan Type] is [MS/MS].
This column is not displayed by default. To use this column, you must add it through [Add/Remove Columns] in the context menu.
Integration Parameters Table
Global/Peaks/Selected Region List Box
[Global]: Select this item to set common integration parameters (global parameters) between peaks.
[Peaks]: Select this item to set integration parameters for only the selected peaks.
When the integration parameters are changed from global parameters, "Custom" is displayed with yellow background in the [Int. Parms.] column on the Peak List table.
[Selected Region]: Appears you click ![]() in the toolbar on the Chromatogram pane. You can set integration parameters
for the selected area. To reintegrate peaks, click the [Reintegrate] button.
in the toolbar on the Chromatogram pane. You can set integration parameters
for the selected area. To reintegrate peaks, click the [Reintegrate] button.
When [Global] is selected
<Change Global Parameters>
Sets the specified integration parameters as the global parameters.
<Reset All Peaks to Global>
Restores the parameters of all peaks to global parameters.
<Reset to Default>
Restore the global parameters to the factory settings.
When [Peaks] is selected
<Apply>
Applies the specified integration parameters to the selected peaks.
<Apply to Mass>
Applies the specified integration parameters to the peaks that come from the selected mass.
<Apply to Comp.>
Applies the specified integration parameters to the peaks that come from the selected compound.
Where X is the RT for another compound, if it satisfies the following condition, the integration parameters are reflected to the compound.
Selected Compound's Method RT - Correlation Window £ X £ Selected Compound's Method RT + Correlation Window
<Apply to All>
Applies the specified integration parameters to all peaks.
<Reset to Global>
Restores the integration parameters of the selected peaks to global parameters.
When [Selected Region] is selected
<Reintegrate>
Applies the specified integration parameters to the selected area and reintegrates the peaks.
![]() Show
help for Integration Parameters.
Show
help for Integration Parameters.
Parameter settings
Integrator
Select the Integrator you want to use.
Agile2
The default Integrator.
You can configure the Peak Threshold and Maximum number of Peaks.
General Integrator
This Integrator allows you to configure more integration parameters than Agile2.
You can configure Detector (General Integrator), Baseline Allocation (General Integrator), Peak Threshold, and Maximum number of Peaks.
Detector (General Integrator)
Data point sampling
The number of points to sample from 1 to 9. The default is 1. Negative values are not allowed. This parameter selects which data points are used in calculating slope sensitivity. With the default selection of 1 every data point is used. Select 2 for every other point, 3 for every third, etc. Sometimes performance can be improved by adjusting this parameter to take advantage of having broader peaks as follows:
Data points across a peak |
Try a setting of |
|---|---|
25 or more |
2 or less |
50 or more |
6 or less |
70 or more |
9 or less |
Smoothing
Whether or not to smooth the chromatogram. Selecting this check box turns on an additional filter that acts on the data when the first derivative is being taken to determine the start/stop points. By default, this parameter is clear. You can select [Smoothing] only when you also select 5-point Filtering.
You can use smoothing to improve results with noisy data. It can also be used anytime the integrator shows a tendency to "split peaks". A split peak is a single chromatographic event or peak that is reported as two peaks because of a minor perturbation in the wave form.
Detection filtering
You can select to use 5, 7 or 9 point filtering. If you have noisy chromatograms, use digital filtering. The default is 5 point. This digital filter smooths the data used to determine peak start and stop points as the first derivative is taken. The parameter lets you select the number of data points to be included in a moving weighted average. Proper parameter selection depends on how narrow or broad typical peaks are and should be done in conjunction with point sampling.
Start threshold
The threshold to start a peak. The range is 0.001 to 100. The default is 0.200. [Start threshold] is rarely changed because the peak detector itself dynamically adjusts the starting threshold to compensate for changing signal levels and noise levels. The default setting of 0.2 is optimal for most chromatograms. A peak is detected or started when the first derivative calculation exceeds the starting threshold, which is in part determined by the parameter setting.
Stop threshold
The threshold to stop a peak. The range is 0 to 100. The default is 0.00. The stop threshold determines when a peak ends. This threshold can be adjusted to vary the amount of a tailing peak that is included in the integrated peak area. Higher values will increase the amount of a tailing peak that is integrated. Noise in the data can cause integration to terminate prematurely. In such cases, try raising the value to 0.3 to 0.5 to extend the end of the peak.
Peak location
Either [Top] or [Centroid] for the peak location. You can select whether the retention time will be reported to the top of a peak or to the centroid (center of the effective area). The default location is top. This option is useful for overloaded peaks that exhibit a flat top or for broad noisy peaks that exhibit several peak maxima.
Baseline Allocation (General Integrator)
Baseline reset (#points) >
The value to use for resetting the baseline. The range is 0 to 500 scans. The default is 5 scans. This parameter is the number of scans that must separate two adjacent chromatographic peaks in order for the coordinates of start and end points of the peaks to be used to define the baseline. If two or more peaks are separated by less than this value, the baseline will be drawn below the abundance at the start or stop of the peak. When [Baseline reset] is set to 0 scans, each peak is evaluated individually. This can be particularly useful for example when a peak's baseline is affected by a shift in abundance.
Each peak is examined relative to its neighboring peaks to determine whether or not the nearby peak can influence the baseline allocation of the peak currently being examined. To see what is happening as the number points is changed, try temporarily changing minimum peak area to 1% so that the smaller adjacent peaks are reported.
If leading or trailing edge <
The percentage to use to trigger the action. This percentage is used to determine whether a drop to baseline or a tangent from start to stop occurs at a peak. The range is 1 to 100%. The default is 100%.
The parameter is a measure of the difference in amplitude of a peak's start / stop points expressed as a percentage of total peak height:
% = 100 * |Ystart - Ystop| / (Ytop - Ymin)
where Ystart and Ystop are respectively the amplitudes at the start and stop points of the peak as measured on the Y axis, Ymin is the lower of Ystart or Ystop, and Ytop is the top of the peak.
Baseline preference
Either [Tangent skim else drop] or [Drop else tangent skim]. The default is [Drop else tangent skim]. This action is used in conjunction with [If leading or trailing edge < ] to cause a baseline drop or a tangent from start to stop of a peak. In the default case of [If leading or trailing edge < ] 100%, then [Drop else tangent skim], baseline drop will be used for all peaks because all peaks satisfy the condition. In the same way, if you choose [Tangent skim else drop], all peaks would have a tangent from start to stop.
If you enter a value other than 100%, then both baseline drops and tangents are possible in a given chromatogram. For example: [If leading or trailing edge < ] 20%, then [Tangent else baseline drop], would cause peaks with less than 20% difference in abundance from start to stop to have the baseline drawn from start to stop. Other peaks would have a drop from start or stop to a horizontal baseline.
A solvent peak may rise too slowly to be recognized as a solvent or there may be a group of peaks well into the run that you feel should be treated as a solvent with a number of rider peaks. This usually involves a merged group of peaks where the first one is far larger than the rest. The simple drop line treatment would exaggerate the later peaks because they are actually sitting on the tail of the first one.
Peak Threshold
In this section, you select which peaks to return based upon either [Peak Area] or [Peak Height].
Peak Area [counts]
Limits which peaks are returned based on the area of the peak in counts.
counts
The minimum number of counts that you want each peak area reported to have. Use area counts when integrating internal standards, system monitoring compounds, and other compounds that will be in the sample at a known concentration. Specification of a minimum area will reduce the likelihood that a small peak or noise might be inadvertently detected and incorrectly assigned to a compound.
Peak Height [counts]
Limits which peaks are returned based on the height of the peak in counts.
counts
The minimum number of counts that you want each peak area reported to have. Specification of a minimum area will reduce the likelihood that a small peak or noise might be inadvertently detected and incorrectly assigned to a compound.
Peak Area [%]
Limits which peaks are returned based on the area of the peak in relation to the largest peak.
% of largest peak
The percentage of the largest peak. Every peak reported has to be larger than this percent of the largest peak. The range is 0 to 100%. Percent of largest peak is frequently used to ensure that only significant chromatographic information is integrated and reported. To reject the small noise peaks, select [% of largest peak].
Peak Height [%]
Limits which peaks are returned based on the height of the peak in relation to the largest peak.
% of largest peak
The percentage to use if you want the height of each peak reported to be at least this percent of the height of the largest peak. The range is 0 to 100%. Percent of largest peak is frequently used to ensure that only significant chromatographic information is integrated and reported. To reject the small noise peaks, select [% of largest peak].
For target compound analysis, area counts is normally the better selection. % of largest peak should not be used for target compound detection because the sensitivity of the detection phase will detect many noise peaks if the target compound is not present. These noise peaks could appear as false positives in the quantitation report.
Area counts affects the peak detector. In this case, the peak detector examines the raw area of each integrated peak to determine if the peak should be retained and submitted to the baseline allocation algorithm.
The area rejection in the detection phase is based on absolute raw area count units. When [% of largest peak] is selected, the minimum area has no effect on the detection phase of the algorithm.
Maximum number of Peaks
Limit to the largest
Whether or not to limit the number of peaks that can be found. The integration will return only the largest number of peaks entered.
Number of peaks
The maximum number of peaks you want the system to be able to find.
To Get Here
- When [Analysis Mode] is set to [Chromatogram] in the [Data Analysis Method] table, click [Integration Parameters] from the [Set up Analyte] group in the Method Development Tasks pane.
- Click [Integration Parameters] from the [Acquisition] group in the Task Navigator.