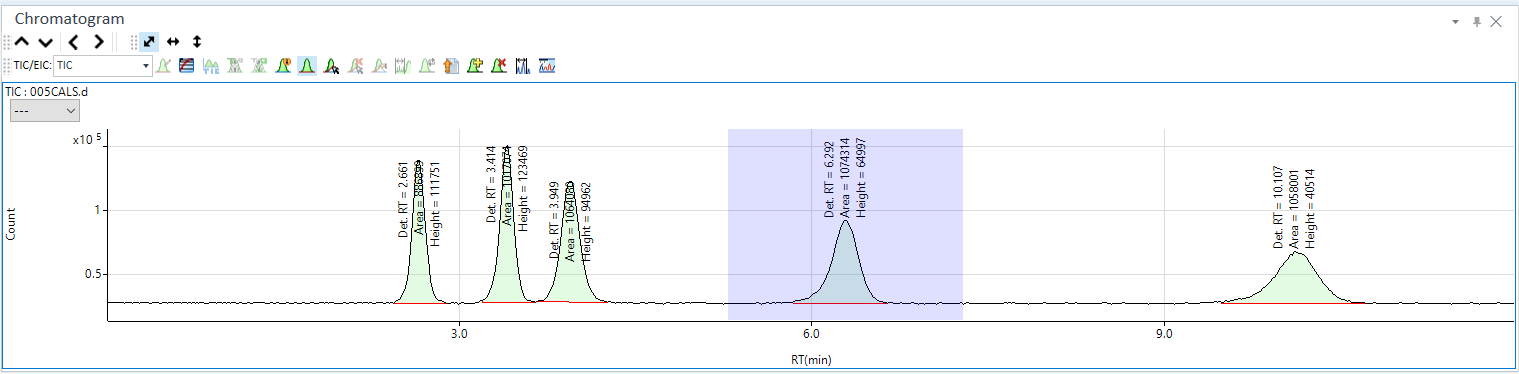
Chromatogram pane (Method Editor)
This section describes the function of the commands that are available in the Chromatogram Pane, which is displayed on the [Method Editor] window when you analyze samples with the optional Chromatographic Analysis software installed. Some functions are different from the ones on the Chromatogram Pane that is displayed in Batch-at-a-Glance.
- Title Bar
- Chromatogram Toolbar
- Functions (Chromatogram) Toolbar
- Zoom Toolbar
- Scale Dropdown List
- Context Menu
- To Get Here
Title Bar
The title bar buttons and the context menu have the same functions as the Title Bar of the Instrument Status Pane.
Chromatogram Toolbar
 Drag to move the toolbar.
 Displays
the graph for the previous sample.
Displays
the graph for the previous sample.
 Displays the graph for the next
sample.
Displays the graph for the next
sample.
 Highlights
the previous peak.
Highlights
the previous peak.
 Highlights the next peak.
Functions (Chromatogram) Toolbar

 Lets you select the type of chromatogram to display.
TIC: Displays a TIC (Total Ion Chromatogram).
Mass: Displays an EIC (Extracted Ion Chromatogram) for the selected mass.
All: Displays all chromatograms.
![]() Changes
the display between log scale and linear scale.
Changes
the display between log scale and linear scale.
![]() Opens the
[Chromatogram
Information] dialog box, which lets you configure the display settings
for labels.
Opens the
[Chromatogram
Information] dialog box, which lets you configure the display settings
for labels.
![]() Displays
or hides the peak baseline.
Displays
or hides the peak baseline.
![]() Starts manual
integration when selected. Stops manual integration when deselected.
Starts manual
integration when selected. Stops manual integration when deselected.
![]() Clears manual
integration.
Clears manual
integration.
![]() Performs
manual integration along the peak.
Performs
manual integration along the peak.
![]() Opens the
[Update
Method for Current Peak] dialog box, which lets you update the retention
time and relative response that are specified in the analysis method with
the values for the current peak.
Opens the
[Update
Method for Current Peak] dialog box, which lets you update the retention
time and relative response that are specified in the analysis method with
the values for the current peak.
![]() Adds
all peaks.
Adds
all peaks.
![]() After the
cursor shape changes to
After the
cursor shape changes to ![]() , if
the peak in purple is clicked, the peak is added to the Peak List table
and the color of the peak turns green.
, if
the peak in purple is clicked, the peak is added to the Peak List table
and the color of the peak turns green.
![]() After the
cursor shape changes to
After the
cursor shape changes to ![]() , if
a peak is clicked, the peak is deleted from the Peak List table and the
color of the peak turns purple in the Chromatogram pane.
, if
a peak is clicked, the peak is deleted from the Peak List table and the
color of the peak turns purple in the Chromatogram pane.
![]() After
the cursor shape changes to
After
the cursor shape changes to ![]() , if
you drag to specify an area, the peak sum or area sum of the multiple
peaks in the area is added to the peak list. You can set the peak type
in the Peak Type column on the Peak
List Table.
, if
you drag to specify an area, the peak sum or area sum of the multiple
peaks in the area is added to the peak list. You can set the peak type
in the Peak Type column on the Peak
List Table.
![]() After
the cursor shape changes to
After
the cursor shape changes to ![]() , if
you drag to select an area that contains white peaks that are not autointegrated,
you can set the integration parameters of the area in the Integration
Parameters Table and reintegrate the peaks. After reintegration,
if you click
, if
you drag to select an area that contains white peaks that are not autointegrated,
you can set the integration parameters of the area in the Integration
Parameters Table and reintegrate the peaks. After reintegration,
if you click ![]() , you can add the peaks
to the Peak
List Table.
, you can add the peaks
to the Peak
List Table.
Zoom Toolbar
The Zoom Toolbar have the same functions as the Zoom Toolbar of the Spectrum pane.
Scale Dropdown List
Lets you select the scale for the Y-axis.
Context Menu
This section describes the commands that are available in the context menu, which is displayed when you right-click in the pane. The commands that are not listed below have the same function as their counterparts on the toolbars and the Ribbon.
[Tabulate Chart]
[Raw Data to CSV]
Exports the raw data to a CSV file, and then opens the CSV file.
[CPS Data to CSV]
Exports the CPS data to a CSV file, and then opens the CSV file.
[Copy]
Copies the selected data to the Clipboard. When a graphics pane is selected, the graphics are copied.
[Page Setup]
Opens the [Page Setup] dialog box where you can configure the page settings for printing.
[Print]
Opens the [Print] dialog box where you can print the contents of the selected pane.
[Print Preview]
Opens the [Print Preview] dialog box where you can display the print preview.
To Get Here
- When [Analysis Mode] is set to [Chromatogram] in the [Data Analysis Method] table, click [Integration Parameters] from the [Set up Analyte] group in the Method Development Tasks pane.