Data Analysis Window Parts and Functions
The [ICP-MSICP-QQQ Data Analysis] window displays information such as the sample list, data analysis results, mass spectra, and calibration curves.
The type and contents of the information that is displayed in the panes depend on the Data Analysis Method and the data acquisition conditions.
Here, the [ICP-MSICP-QQQ Data Analysis] window for the FullQuant analysis is used as an example.
For the parts and functions of each pane, refer to the respective sections.
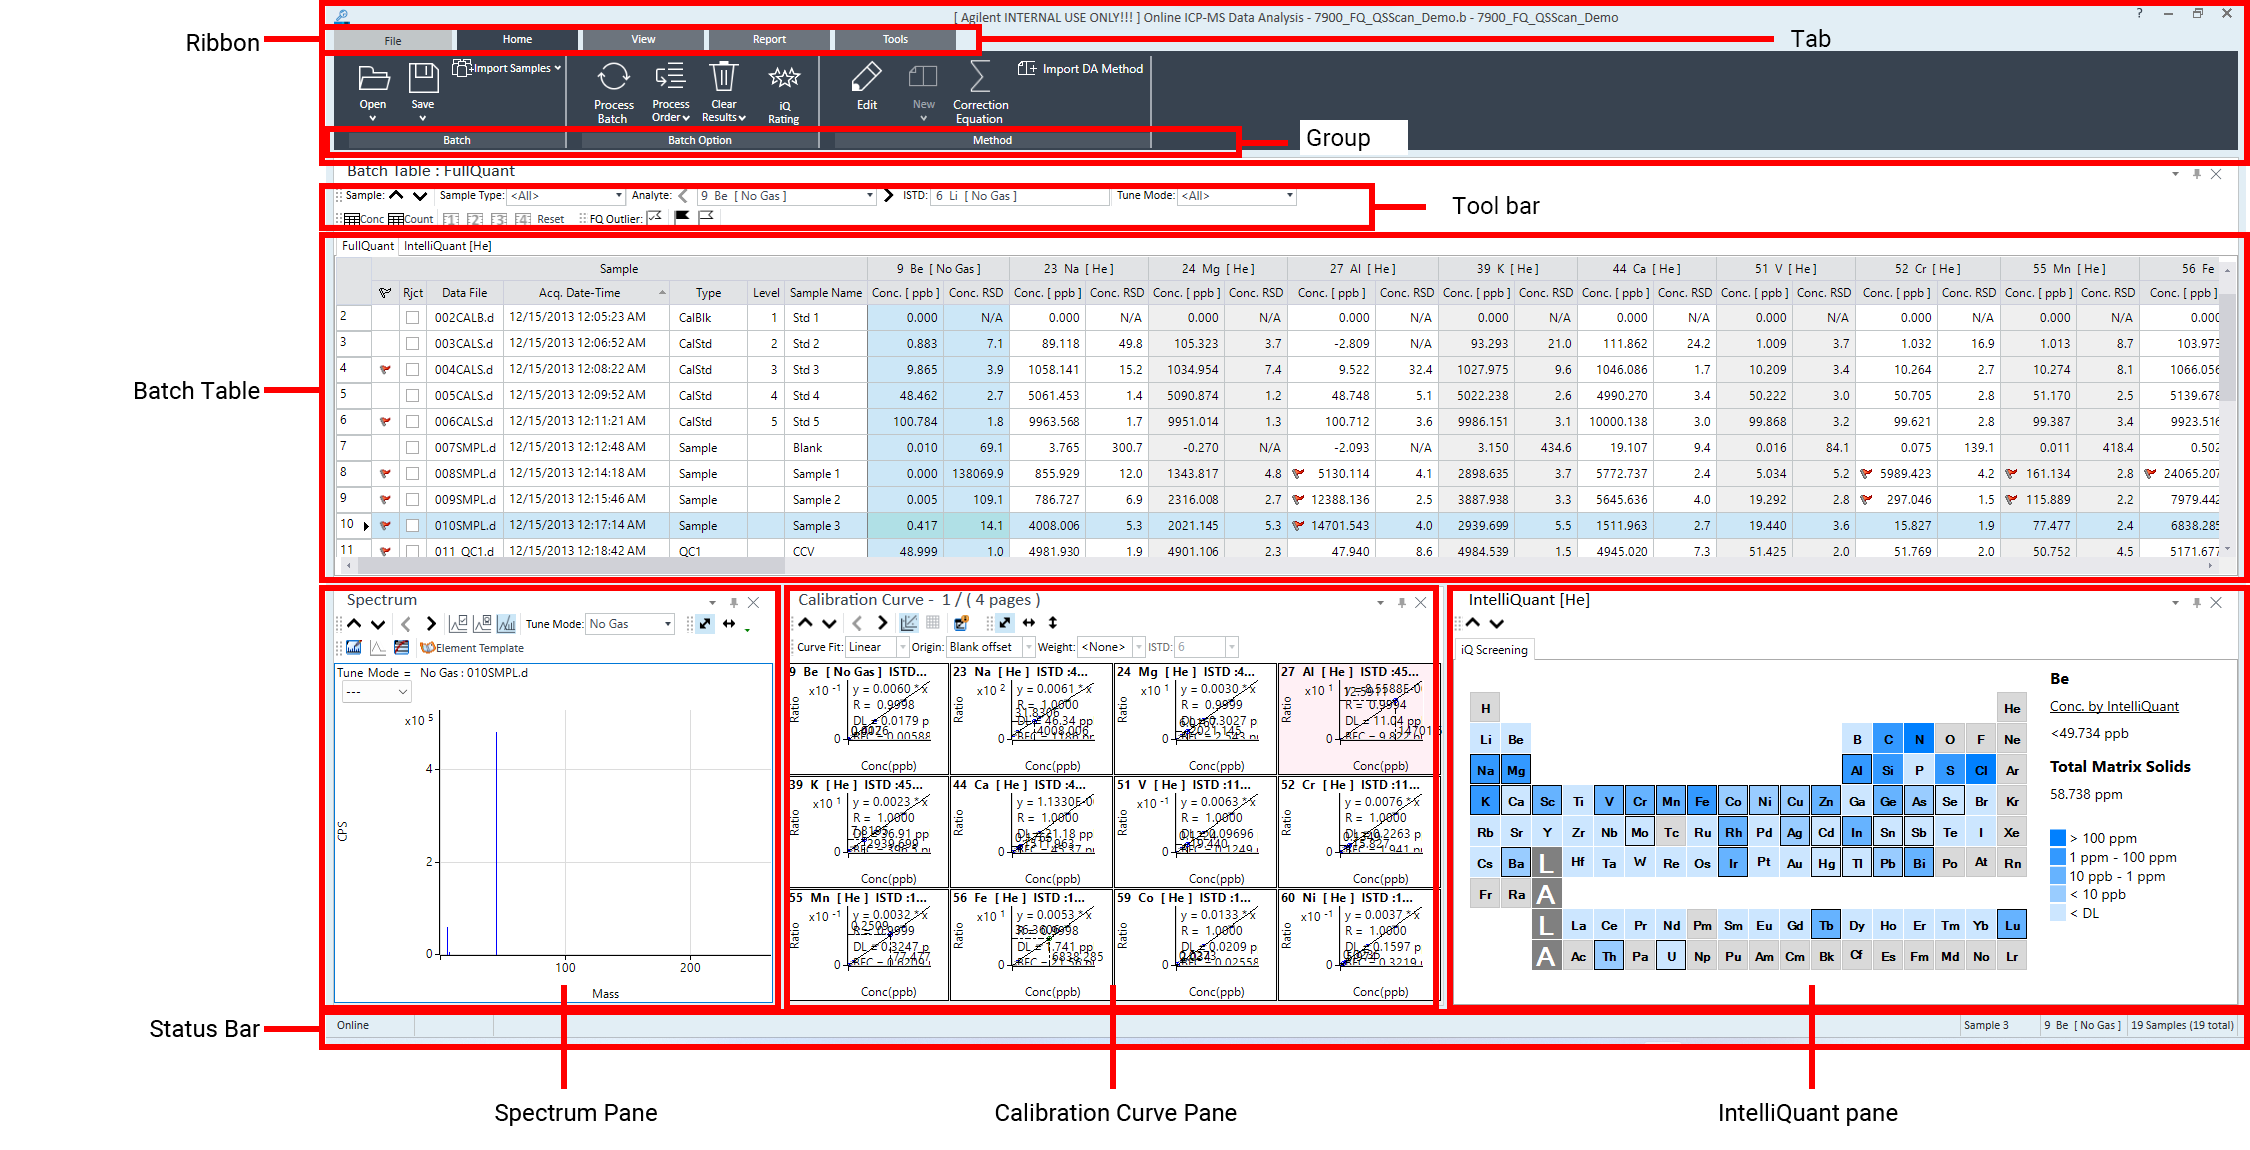
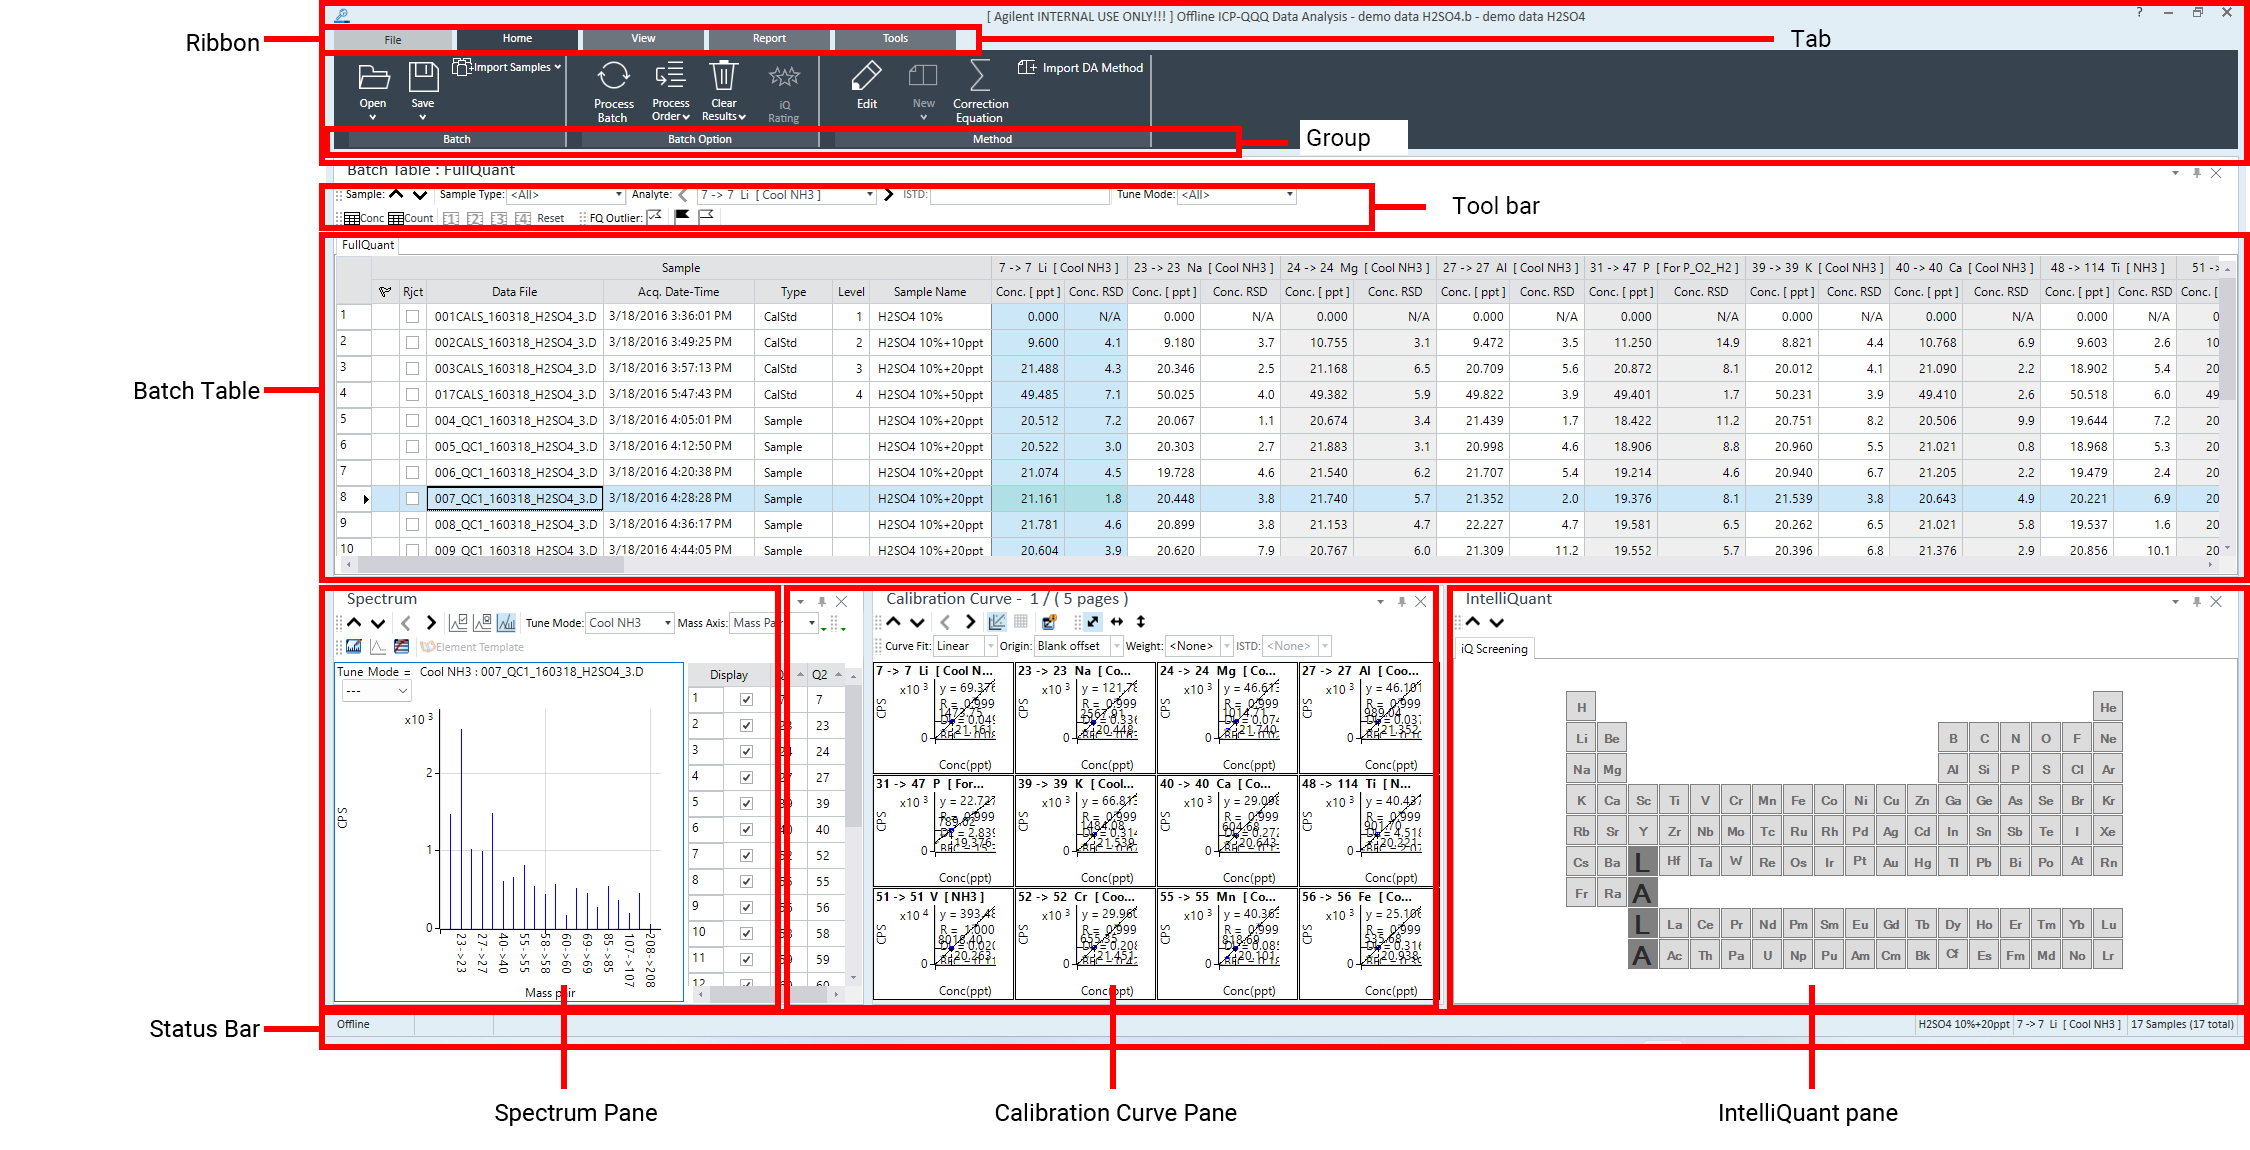
[ICP-MSICP-QQQ Data Analysis] Window
Panes
By default, three panes are displayed in the [ICP-MSICP-QQQ Data Analysis] window. The types of panes that are displayed depend on the Data Analysis Method of the current sample.
For details of functions common to all panes, refer to “Common Pane Operations”.
- Batch Table Pane
- Spectrum Pane
- ISTD Stability Graph Pane
- Calibration Curve Pane
- SemiQuant Factor Pane
- IntelliQuant pane
- Timechart Pane
- QC Sample Stability Graph Pane
- Chromatogram Pane
- Particle Size Distribution Pane
- Single Particle Method Editor Pane
Batch Table Pane
The Batch Table pane displays the sample list and the analysis results.
For more information, see “Batch Table Pane Operation”.
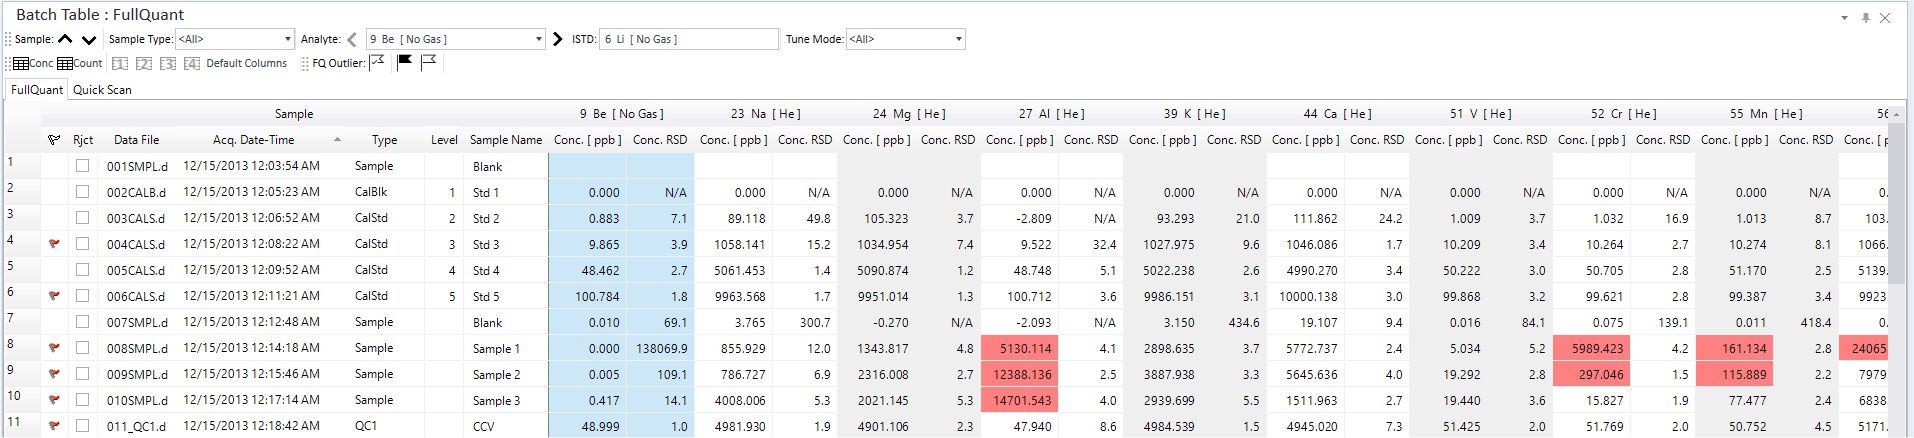
Batch Table Pane
Spectrum Pane
For data that was acquired in Spectrum Acquisition mode, the mass spectra for the data are displayed.
For more information, see “Spectrum Pane Operation”.
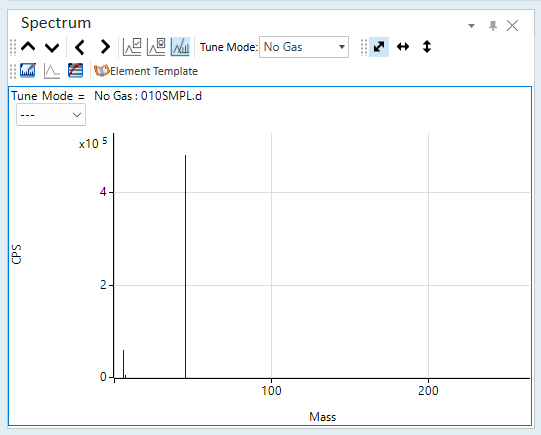
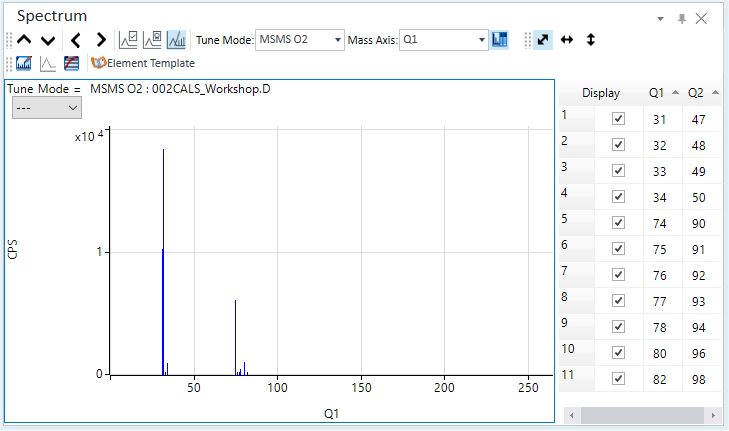
Spectrum Pane
ISTD Stability Graph Pane
For data that was acquired using Internal Standard Correction, the ISTD Stability Graph pane is displayed.
For more information, see “ISTD Stability Graph Pane Operation”.
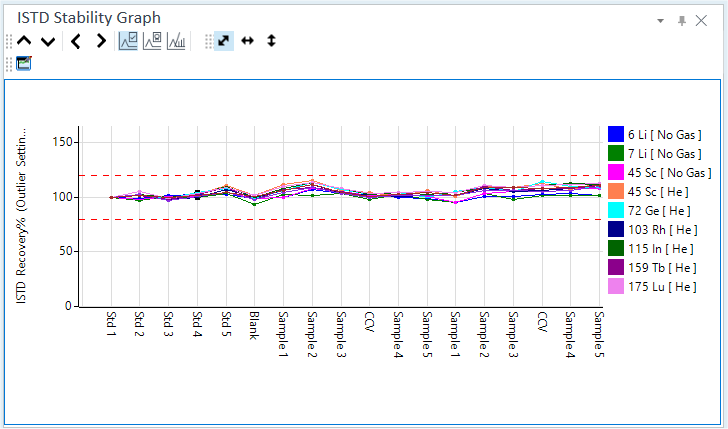
ISTD Stability Graph Pane
Calibration Curve Pane
For a quantitative analysis, the calibration curves for the sample selected in the Batch Table pane are displayed in the Calibration Curve pane.
For more information, see “Calibration Curve Pane Operation”.
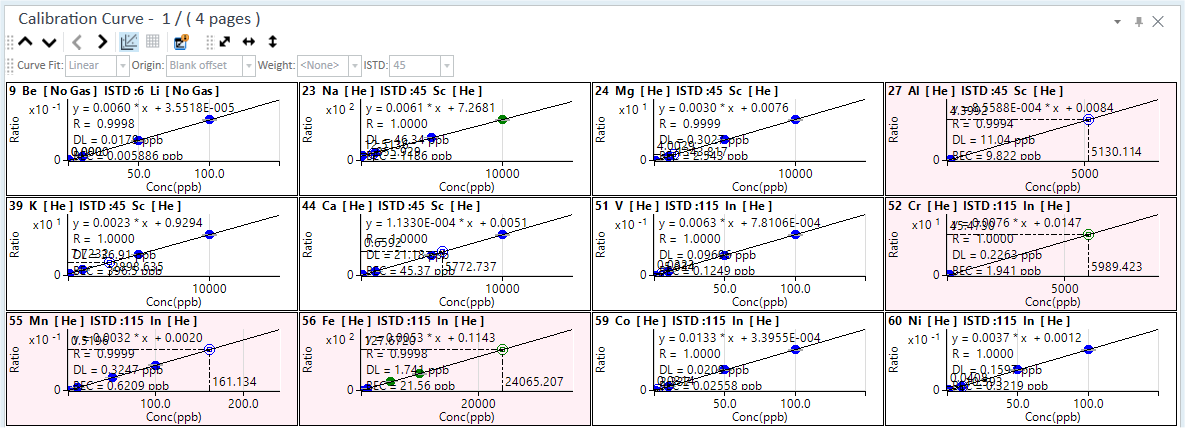
Calibration Curve Pane
SemiQuant Factor Pane
For a semiquantitative analysis, the SemiQuant Factor pane is displayed.
For more information, see “SemiQuant Factor Pane Operations”.
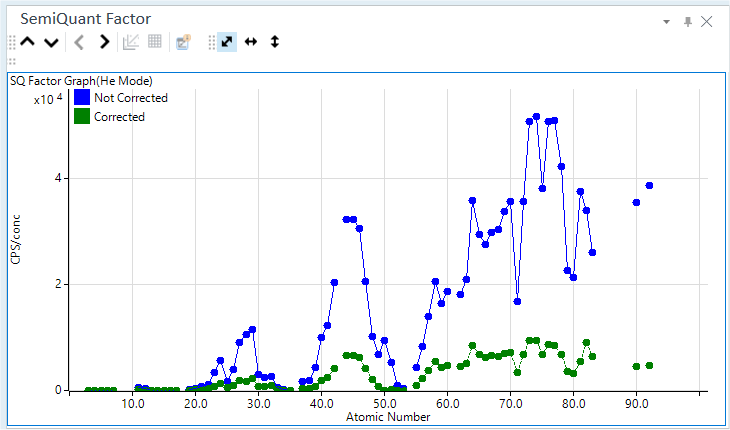
SemiQuant Factor Pane
IntelliQuant pane
For a SemiQuant analysis, the IntelliQuant pane is displayed on the [IntelliQuant] tab when IntelliQuant is set to On.
For more information, refer to "IntelliQuant pane Operation".
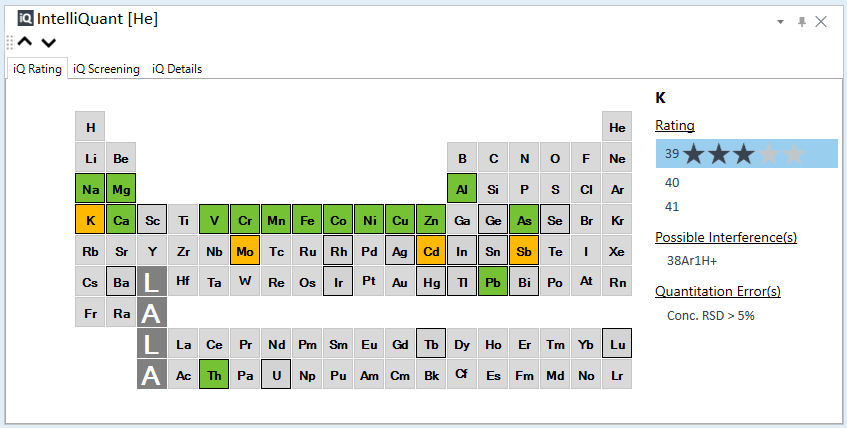
IntelliQuant pane
Timechart Pane
For data that is acquired in Time Resolved Analysis mode or the Time Program mode, the Timechart pane is displayed.
For more information, see “Timechart Pane Operation”.
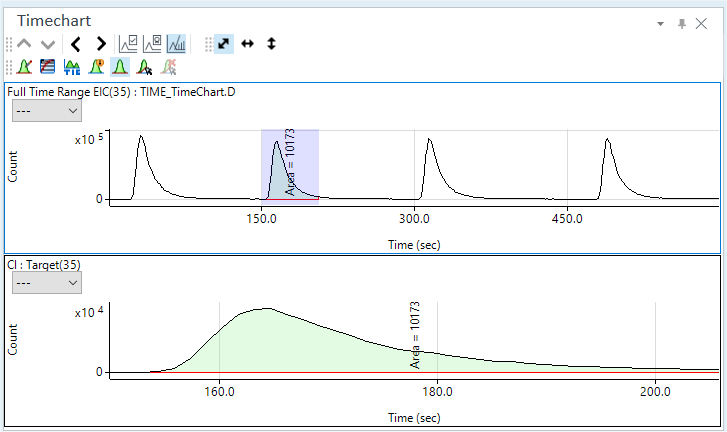
Timechart Pane
QC Sample Stability Graph Pane
Displays the QC Sample Stability Graph.
For more information, see “QC Sample Stability Graph Pane Operation”.
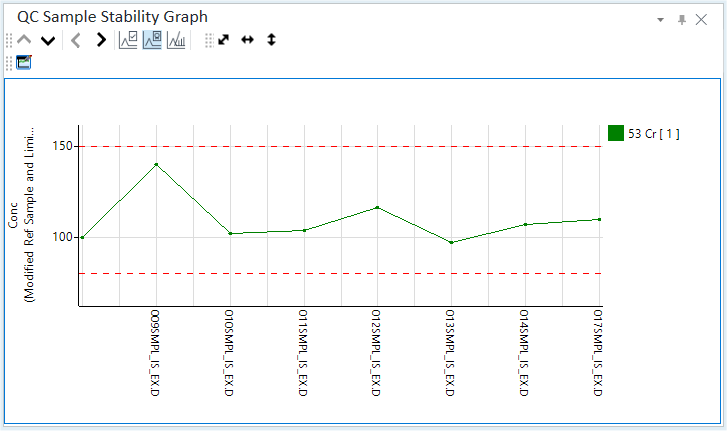
QC Sample Stability Graph Pane
Chromatogram Pane
For data that is acquired with the optional Chromatographic application, the Chromatogram pane (Option) is displayed.
For more information, see “Chromatogram Pane Operations”.
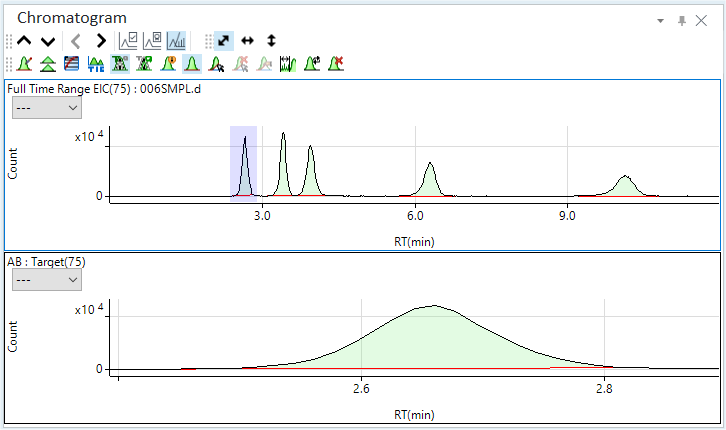
Chromatogram Pane
Particle Size Distribution Pane
For data that is acquired with the optional Single Particle Analysis application, the Particle Size Distribution pane (Option) is displayed.
For more information, see “Particle Size Distribution Pane Operations”.
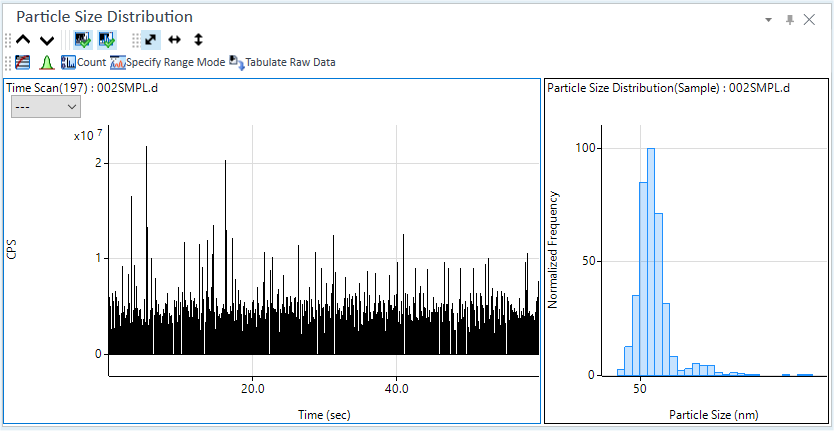
Particle Size Distribution Pane
Single Particle Method Editor Pane
For data that is acquired with the optional Single Particle Analysis application, the Single Particle Method Editor pane (Option) is displayed.
For more information, see “Single Particle Method Editor Pane Operations”.
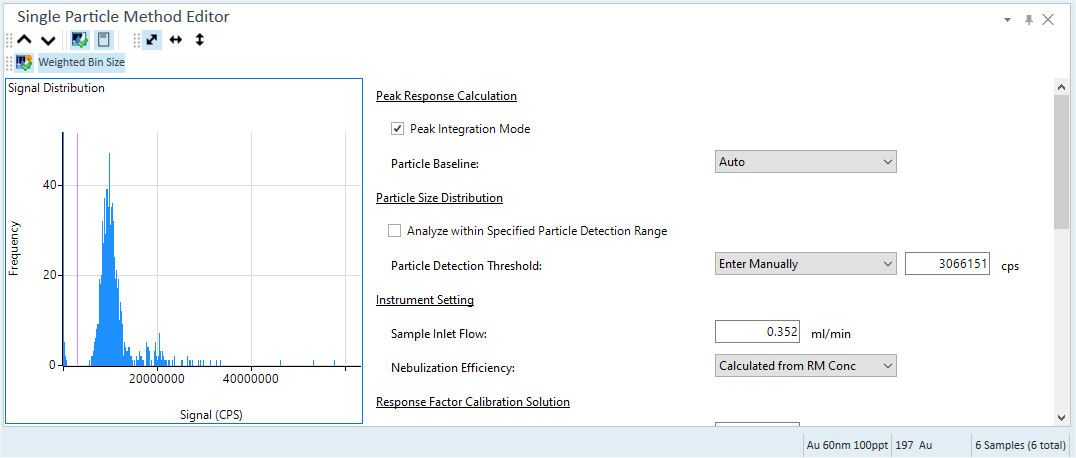
Single Particle Method Editor Pane
Status Bar
The status bar shows the sample name, analyte, and other information about the selected sample in the Batch Table pane.
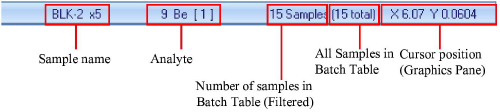
Status bar
You can apply a filter to the data displayed using
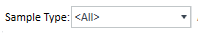 on the Batch Table toolbar.
The XY value shown at the right side of the status bar reflects which pane currently has the cursor.
Selecting [Count Display Mode] from the context menu in the graphics pane displays only the count for the sample that is selected in the Batch Table. For example, even if using overlay chromatogram, the count will only be shown for the selected sample on the Batch table. The cursor display on the status bar lets you view each peak value even when using the overlay feature.