ISTD Stability Graph Pane Operation
This section describes the operation of the ISTD Stability Graph pane. For information about functions that are common to all panes, refer to “Common Pane Operations”.
ISTD Stability Graph Pane
Displaying the ISTD Stability Graph
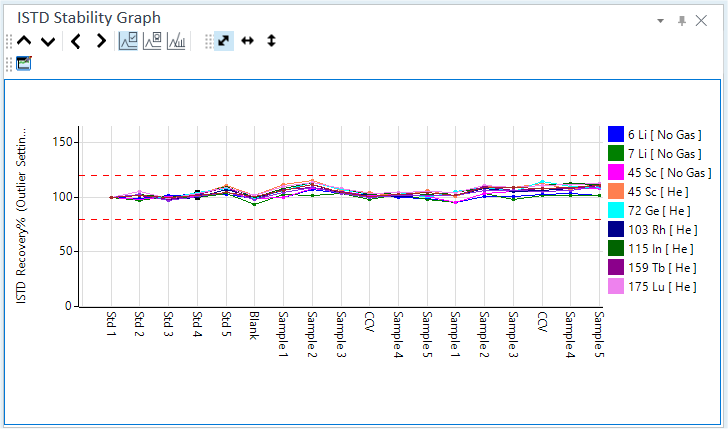
The ISTD Stability Graph pane lists the recovery (%) for each ISTD element of all samples that are displayed in the Batch Table. The X-axis represents the sample name or the data file name, and the Y-axis represents the ISTD recovery (%). ISTD recovery is the percentage representation of the concentration ratio between the CalBlk sample and the ISTD element.
Data that is selected in the Batch Table is emphasized with black dots in the ISTD Stability Graph. To display data for a different sample in the ISTD Stability Graph pane, click one of the following icons on the ISTD Stability Graph pane toolbar.
 Emphasizes
the previous sample.
Emphasizes
the previous sample.
 Emphasizes the next sample.
If the ISTD
Stability Graph pane is not shown, click [Panes] from the [Show]
group on the [View] tab. Also, check that  on
the toolbar is inverted. If is not inverted,
click it.
on
the toolbar is inverted. If is not inverted,
click it.
Toolbar Functions
For the information about functions of the toolbar, refer to “ISTD Stability Graph pane”.
Adjusting the scales
The scale for the X- and Y-axes can be changed. For more information, refer to “Adjusting the scales” under “Common Graph Operations”.
Shifting the axes
The X- and Y-axes can be transposed. For more information, refer to “Shifting the axes” under “Common Graph Operations”.
Expanding a selected area
You can zoom in on a selected area of the ISTD Stability Graph. For more information, refer to “Expanding a selected area” under “Common Graph Operations”.
Customizing the ISTD stability graph
The ISTD Stability Graph can be customized. Items that can be changed are: which reference samples to use for the recovery calculation, which ISTD elements to display the normal value range, and the X-axis contents.
- Click the
 icon on the toolbar.
The [ISTD Stability Graph Setting] dialog box is displayed.
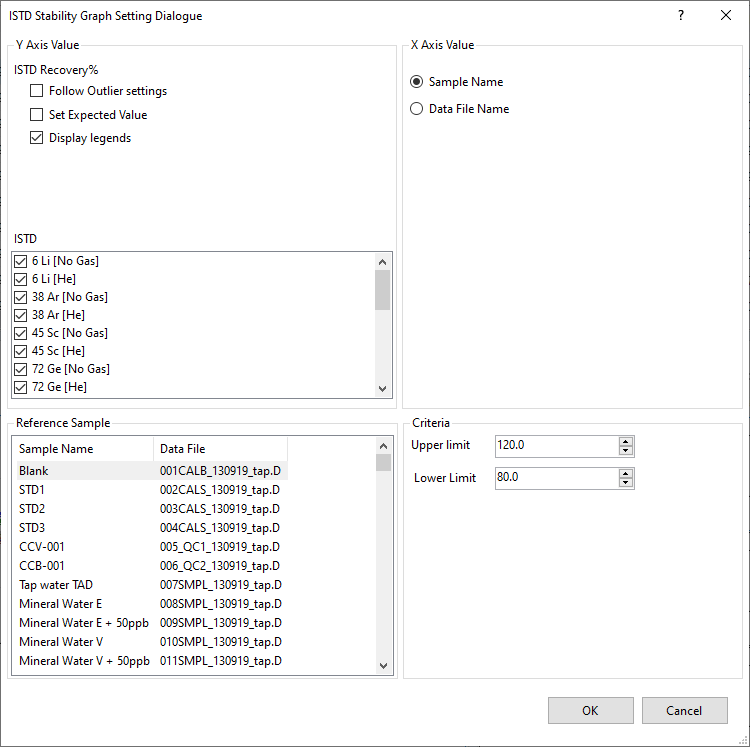
[ISTD Stability Graph Setting] Dialog Box
- Clear the [Follow Outlier Settings] check box.
- Change the display settings for the ISTD Stability Graph.
For more information, refer to the Help for the [ISTD Stability Graph Setting] dialog box.
- When finished, click <OK>.
The ISTD Stability Graph is updated.
Copying the ISTD stability graph
The ISTD Stability Graph can be copied to the Clipboard. It can then be pasted into documents that are created with other applications. For more information, refer to “Copying the graphs” under “Common Graph Operations”.
Printing the ISTD stability graph
The ISTD Stability Graph can be printed. For more information, refer to “Printing the panes” under “Common Pane Operations”.
Exporting the ISTD stability graph
The ISTD Stability Graph can be exported in various graphics file formats. For more information, refer to “Exporting the graphs“ under “Common Graph Operations”.