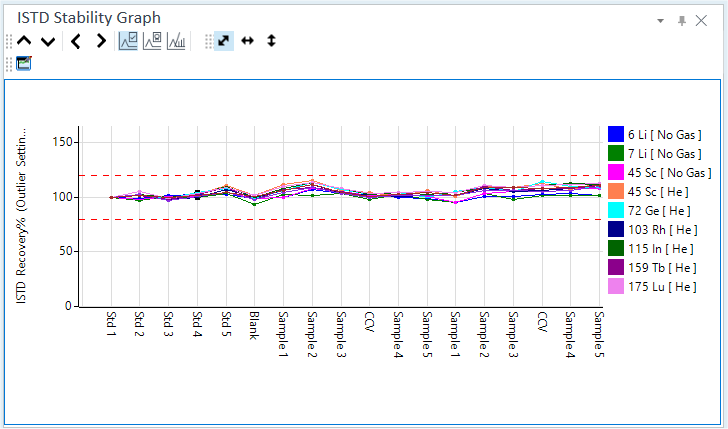
ISTD Stability Graph pane
This section describes the function of the commands that are available in the ISTD Stability Graph pane.
- Title Bar
- Spectrum/Chromatogram Toolbar
- Functions (Spectrum/Chromatogram) Toolbar
- Zoom Toolbar
- Context Menu
- To Get Here
Title Bar
The title bar buttons and the context menu have the same functions as the Title Bar of the Instrument Status Pane.
Spectrum/Chromatogram Toolbar

 Drag to move the toolbar.
 Emphasizes
the previous sample.
Emphasizes
the previous sample.
 Emphasizes the next sample.
 Displays
the graph for the previous element.
Displays
the graph for the previous element.
 Displays the graph for the next
element.
Displays the graph for the next
element.
 Displays
or hides the ISTD Stability Graph.
Displays
or hides the ISTD Stability Graph.
 Displays
or hides the QC Sample Stability Graph.
Displays
or hides the QC Sample Stability Graph.
 Displays
or hides the Spectrum/Chromatogram.
Displays
or hides the Spectrum/Chromatogram.
Functions (Spectrum/Chromatogram) Toolbar

![]() Opens the
[ISTD
Stability Graph Setting] dialog box, which lets you configure the
display settings for the ISTD Stability Graph.
Opens the
[ISTD
Stability Graph Setting] dialog box, which lets you configure the
display settings for the ISTD Stability Graph.
Zoom Toolbar
The Zoom Toolbar have the same functions as the Zoom Toolbar of the Spectrum pane.
Context Menu
This section describes the commands that are available in the context menu. The commands that are not listed below have the same function as their counterparts on the toolbars and the Ribbon.
[Copy]
Copies the selected data to the Clipboard. When a graphics pane is selected, the graphics are copied.
[Page Setup]
Opens the [Page Setup] dialog box for configuring the page settings for printing.
[Print]
Opens the [Print] dialog box where you can print the contents of the selected pane.
[Print Preview]
Opens the [Print Preview] dialog box where you can display the print preview.
[Export Graphics]
Opens the [Export Graphics] dialog box where you can export the graphics data. This command is available when a pane that includes graphics is selected.
To Get Here
- Open the batch result in the [ICP-MSICP-QQQ Data Analysis] window.
- Select [Panes] - [Spectrum/Timechart] from the [Show] group on the [View] tab in the [ICP-MSICP-QQQ Data Analysis] window.
- Click on the Spectrum/Chromatogram
toolbar in the Spectrum pane.