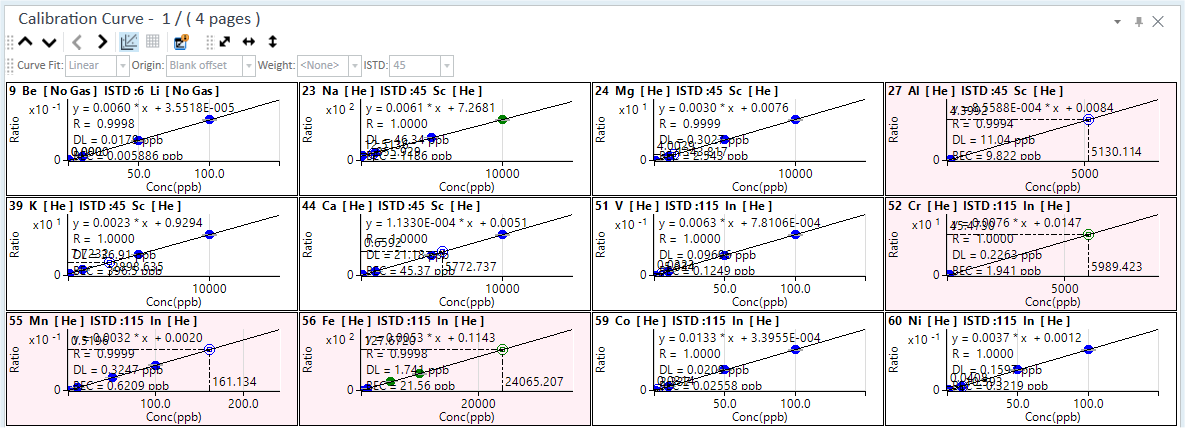
Calibration Curve pane
This section describes the functions of the commands that are available in the Calibration Curve pane.
- Title Bar
- Calibration Curve Toolbar
- Functions (Calibration Curve) Toolbar
- Zoom Toolbar
- Context Menu
- To Get Here
For formulas see: Reference > Equations > Calibration.
Title Bar
The title bar buttons and the context menu have the same functions as the Title Bar of the Instrument Status Pane.
Calibration Curve Toolbar
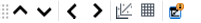
 Drag to move the toolbar.
 Displays
the calibration curve for the previous sample.
Displays
the calibration curve for the previous sample.
 Displays the calibration curve
for the next sample.
Displays the calibration curve
for the next sample.
 In
the twelve-curve view, the calibration curves on the previous page are
displayed. In the single curve view, the calibration curve for the previous
element is displayed.
In
the twelve-curve view, the calibration curves on the previous page are
displayed. In the single curve view, the calibration curve for the previous
element is displayed.
 In the twelve-curve view, the calibration
curves on the next page are displayed. In the single curve view, the calibration
curve for the next element is displayed.
In the twelve-curve view, the calibration
curves on the next page are displayed. In the single curve view, the calibration
curve for the next element is displayed.
 Changes
between displaying a single calibration curve or twelve calibration curves.
Changes
between displaying a single calibration curve or twelve calibration curves.
 Displays or hides the calibration
curve table when displaying a single calibration curve.
Displays or hides the calibration
curve table when displaying a single calibration curve.
 Displays
or hides the calibration curve information on the graph.
Displays
or hides the calibration curve information on the graph.
Functions (Calibration Curve) Toolbar

 Changes the Curve
Fit of the calibration curve.
Changes the Curve
Fit of the calibration curve.
 Changes the Origin of
the calibration curve.
Changes the Origin of
the calibration curve.
 Changes the Calibration
curve weighting of the calibration curve.
Changes the Calibration
curve weighting of the calibration curve.
 Changes the element (isotope) of the internal
standard.
Changes the element (isotope) of the internal
standard.
 Only available when the optional Chromatographic
Analysis software is installed. When you substitute the calibration curve
of another peak, you can select spike or peak name from the list.
Only available when the optional Chromatographic
Analysis software is installed. When you substitute the calibration curve
of another peak, you can select spike or peak name from the list.
Zoom Toolbar
The Zoom Toolbar have the same functions as the Zoom Toolbar of the Spectrum pane.
Context Menu
This section describes the commands that are available in the context menu, which is displayed when you right-click in the pane. The commands that are not listed below have the same function as their counterpart on the toolbars and the Ribbon.
[X-Log scale]
Changes the X-axis to a log scale.
[Y-Log scale]
Changes the Y-axis to a log scale.
[Apply Change to Current Calibration]
Applies the changes to the selected calibration curve group settings. If unchecked, the settings are applied to all calibration curve groups.
Apply ISTD Change to
Displays the [Apply ISTD Change to] menu.
[ALL]
Applies the changes to the ISTD settings for all calibration curve groups.
[Current Calibration]
Applies the changes to the ISTD settings for the selected calibration curve groups.
[Current Sample]
Applies the changes to the ISTD settings for the selected sample.
[Export Summary]
The [Export Summary] dialog box is displayed and the calibration curve information is exported to a file.
[Print Calibration]
[Simple]
Displays the simple print preview of the calibration curve information.
[Detail]
Displays the detailed print preview of the calibration curve information.
[Copy]
Copies the selected data to the Clipboard. When a graphics pane is selected, the graphics are copied.
[Page Setup]
Opens the [Page Setup] dialog box for configuring the page settings for printing.
[Print]
Opens the [Print] dialog box where you can print the contents of the selected pane.
[Print Preview]
Opens the [Print Preview] dialog box where you can display the print preview.
[Export Graphics]
Opens the [Export Graphics] dialog box where you can export the graphics data. This command is available when a pane that includes graphics is selected.
To Get Here
- Open the FullQuant analysis batch result in the [ICP-MSICP-QQQ Data Analysis] window.
- Select [Panes] - [Calibration Curve] from the [Show] group on the [View] tab in the [ICP-MSICP-QQQ Data Analysis] window.