Calibration Curve Pane Operation
This section describes the operation of the Calibration Curve pane. For descriptions of functions that are common to all panes, refer to “Common Pane Operations”.
Calibration Curve Pane
Displaying Calibration Curves
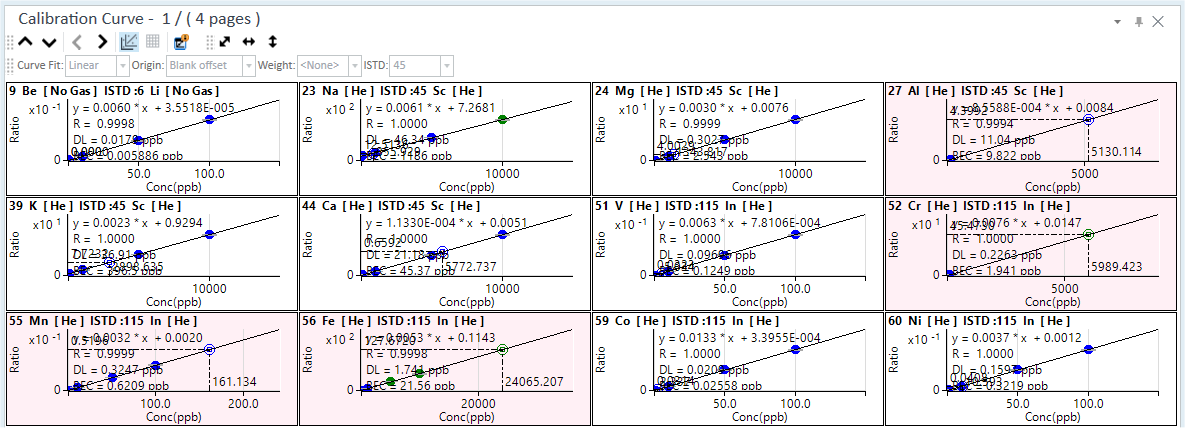
The Calibration Curve pane shows calibration curves for each element of the samples displayed in the Batch Table. The X-axis represents the concentration, and the Y-axis represents the CPS, count or the ratio.
To display different data in the Calibration Curve pane, click one of the following icons on the Calibration Curve pane toolbar.
 Displays
the calibration curve for the previous sample.
Displays
the calibration curve for the previous sample.
 Displays the calibration curve
for the next sample.
Displays the calibration curve
for the next sample.
 In
the twelve-curve view, the calibration curves on the previous page are
displayed. In the single curve view, the calibration curve for the previous
element is displayed.
In
the twelve-curve view, the calibration curves on the previous page are
displayed. In the single curve view, the calibration curve for the previous
element is displayed.
 In the twelve-curve view, the calibration
curves on the next page are displayed. In the single curve view, the calibration
curve for the next element is displayed.
In the twelve-curve view, the calibration
curves on the next page are displayed. In the single curve view, the calibration
curve for the next element is displayed.
If the Calibration Curve pane is not shown, click [Panes] from the [Show] group on the [View] tab.
Displaying Outliers
Calibration curves that have an outlier are shown in pink. The show/hide settings and the determination conditions for the calibration curve outliers are set by the Data Analysis Method. For more information, refer to “FullQuant Outlier Setup pane” help topic.
Toolbar Functions
For information about the functions of the toolbar, refer to “Calibration Curve pane” help topic.
Adjusting the scales
The scale for the X- and Y-axes can be changed. For more information, refer to “Adjusting the scales” under “Common Graph Operations”.
Shifting the axes
The X and Y axes can be transposed. For more information, refer to “Shifting the axes” under “Common Graph Operations”.
Expanding a selected area
You can zoom in on the selected area of a calibration curve. For more information, refer to “Expanding a selected area” under “Common Graph Operations”.
Changing the layout
There are two layouts available in the Calibration Curve pane. The default layout shows calibration curves for 12 elements. The other layout shows an expanded calibration curve for one element.
To switch the layout, click  on the Calibration
Curve pane toolbar. When in the 12-element view, you can also
switch to the single-element view by clicking on the calibration curve
to enlarge.
on the Calibration
Curve pane toolbar. When in the 12-element view, you can also
switch to the single-element view by clicking on the calibration curve
to enlarge.
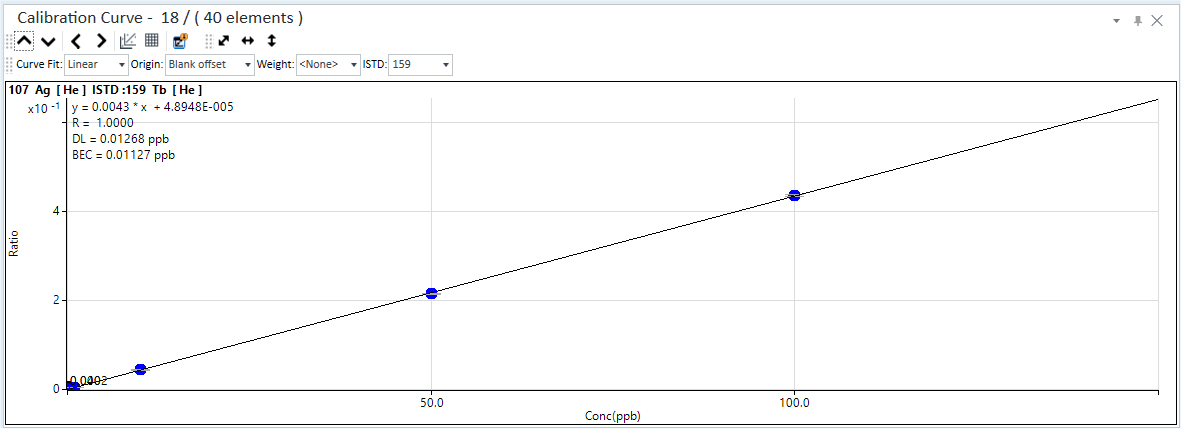
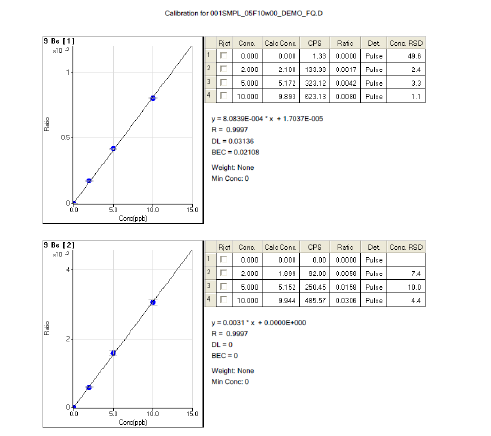
Calibration Curve Pane in Singe-Element View
Displaying calibration curve information
The calibration curve information can be displayed in the calibration curve graph.
- Click the
 icon
on the toolbar.
icon
on the toolbar.
The icon is inverted, and the calibration curve information is displayed along the calibration curve. The following information is displayed:
- Formula for the calibration curve
- R (correlation coefficient)
- DL (detection limit)
- BEC (background-equivalent concentration)
- To hide the calibration curve information, click again.
Displaying the calibration curve table
The calibration curve table can be used to check the details of the calibration curves. To display the calibration curve table, follow these steps:
- In the twelve-element view, double-click an element’s calibration
curve to display its calibration curve table.
The layout switches to the single-element view.
- Click the
 icon on the toolbar.
The calibration curve table for the selected element is displayed.
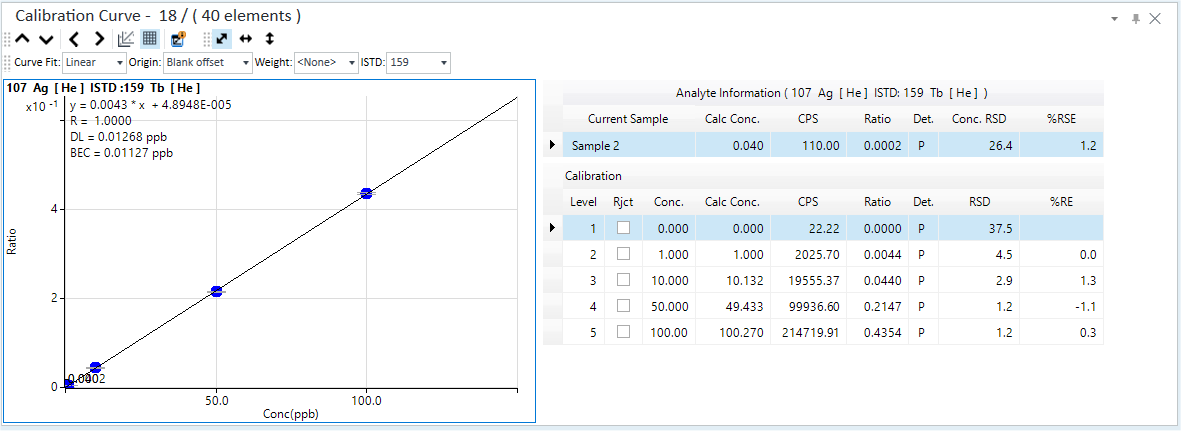
Calibration Curve Table
- To hide the calibration curve table, click again.
Changing the calibration curve settings
The settings that are used to generate each calibration curve can be modified.
Changing the calibration curve settings recalibrates the plot and calibration table values. Values for the selected samples in the batch table are also recalculated. To recalculate all samples, click
 .
.To apply the new calibration curve to the batch, perform an analysis.
Changes that you make on the Calibration Curve pane are also applied to the data analysis method.
- Ignoring a calibration curve level
- Changing the calibration curve type
- Changing how the origin is used
- Changing the weighting of calibration samples
- Changing the which elements are used for ISTD
- Changing the concentration of a calibration curve level
Ignoring a calibration curve level
You can ignore selected calibration curve levels from the calibration curve. To ignore a calibration curve level, follow these steps:
- Move the cursor towards the calibration curve level to be ignored.
Information about the selected calibration curve level is displayed in a popup.
Ignoring the Calibration Curve Level
- When an “X” is displayed to the right of the cursor, click.
The pointer color lightens.
The calibration curve level is ignored, and the calibration curve is updated.
To restore a calibration curve level, move the cursor towards the point to be restored, and click when a check mark is displayed to the right of the cursor.
Changing the calibration curve type
The Curve Fit (formula) can be changed. To change the Curve Fit, follow these steps:
- In the twelve-element view, double-click the calibration curve
for the element to change the calibration curve type of.
The layout changes to the single-element view.
- Right-click on the Calibration
Curve pane.
The context menu is displayed.
- To change the setting for the selected calibration curve group only, select [Apply changes to current calibration] so that it becomes checked. If there is no check on the item, the changes will be applied to all calibration curve groups.
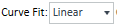 Select
the Curve Fit
from the list.
Select
the Curve Fit
from the list.
The calibration curve is updated.
Changing how the origin is used
You can select whether to include the origin (0.0) in the calibration curves. To change how the Origin is used, follow these steps:
- In the 12-element view, double-click the calibration curve for
the element to change the Origin
for.
The layout changes to the single-element view.
- Right-click on the Calibration
Curve pane.
The context menu is displayed.
- To change the setting for the selected calibration curve group only, mark [Apply changes to current calibration]. If this item is not marked, then the changes are applied to all calibration curve groups.
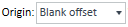 Select the Origin
from the list.
Select the Origin
from the list.
The calibration curve is updated.
Changing the weighting of calibration samples
The Calibration curve weighting that is given to different calibration samples can be changed. To change the weighting, follow these steps:
- In the 12-element view, double-click the calibration curve for
the element to change the weight for.
The layout changes to the single-element view.
- Right-click on the Calibration
Curve pane.
The context menu is displayed.
- To change the setting for the selected calibration curve group only, mark [Apply changes to current calibration]. If this item is not marked, then the changes are applied to all calibration curve groups.
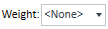 Select the Calibration
curve weighting from the list.
Select the Calibration
curve weighting from the list.
The calibration curve is updated.
Changing the which elements are used for ISTD
The elements (isotopes) that are used for the ISTD can be changed.
- In the 12-element view, double-click the calibration curve for
the element to change the ISTD elements for.
The layout switches to the single-element view.
- Right-click on the Calibration
Curve pane.
The context menu is displayed.
- Select [Apply
ISTD Change to], then select one of the following from the submenu.
- [ALL]: Applies the ISTD setting changes to all calibration curve groups.
- [Current Calibration]: Applies the ISTD setting changes to the selected calibration curve group.
- [Current Sample]: Applies the ISTD setting changes to the selected sample.
 Select the ISTD element from the list.
The calibration curve is updated.
Changing the concentration of a calibration curve level
The concentration of a calibration curve level can be changed. To change the concentration, follow these steps:
- Display the calibration curve table for the calibration curve to
be modified.
For more information, refer to “Displaying the calibration curve table”.
- Right-click on the Calibration
Curve pane.
The context menu is displayed.
- To change the setting for the selected calibration curve group only, mark [Apply changes to current calibration]. If this item is not marked, then the changes are applied to all calibration curve groups.
- Change the values in Conc. column of the Calibration Table.
The calibration curve is updated.
Executing analyses
To perform an analysis with the new calibration curve, complete the following step:
- Click the icon
on the toolbar.
The analysis is performed, and the results in the Batch Table pane are updated.
Copying calibration curves
Calibration curves can be copied to the Clipboard. They can then be pasted into documents that are created with other applications. For more information, refer to “Copying the graphs” under “Common Graph Operations”.
Printing Calibration Data Information
Calibration curve information can be printed.
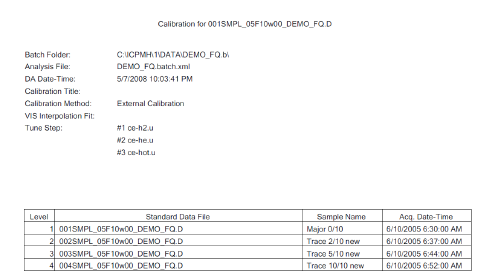
Printout of calibration curve information
The contents and layout of this report cannot be changed.
This report prints on the Windows default printer.
To print the calibration curve information, follow these steps:
- Select [Print] - [Simple] or [Detail] from the [Calibration] group
on the [Report] tab.
The print preview pane is displayed.
- Click the [Print] button.
The calibration curve information is printed.
Printing calibration data
Calibration curves can be printed. For more information, refer to “Printing the panes” under “Common Pane Operations”.
Exporting the Calibration Curve Summary
You can export a summary of the calibration curve information in several file format.
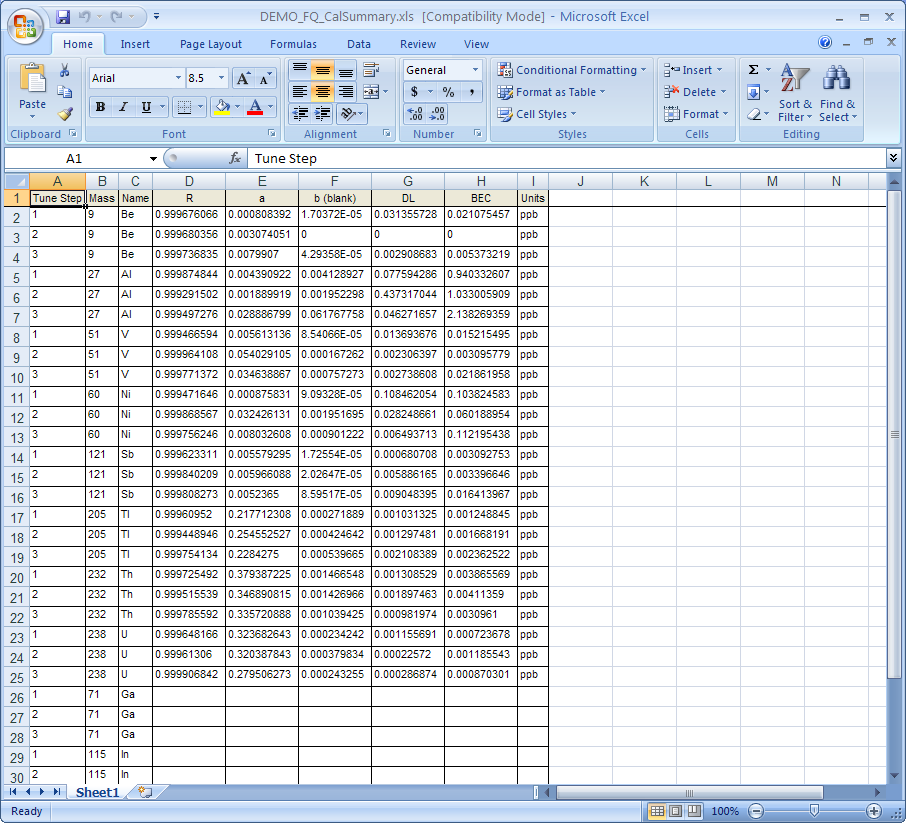
Exported summary (when using the Excel)
To export calibration curve summary information, follow these steps:
When using ECM, OpenLab Server Products, Workstation Plus, or SDA, the displayed dialog box and the save file destination differ from standard MassHunter operations. For more information, refer to " Operations When Database Systems Are Used" in "Reference".
- Click the [Export Calibration Summary] from the [Calibration] group
on the [Report] tab.
The [Export Summary] dialog box appears.
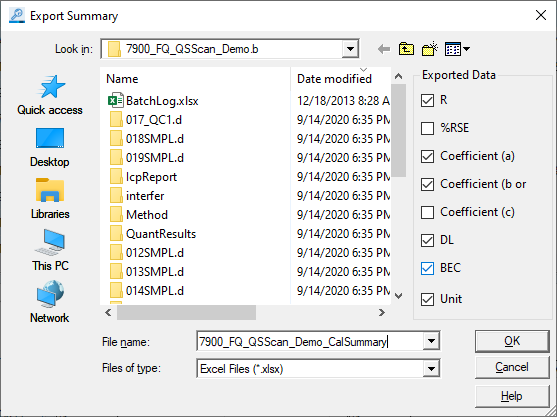
[Export Summary] Dialog Box
- Select the check box for each item to include in the summary report.
The following items are available:
- R: Correlation coefficient
- %RSE: Relative Standard Error (%)
- Coefficient (a): coefficient a in the calibration curve
- Coefficient (b or blank): coefficient b or blank in the calibration curve
- Coefficient (c): coefficient c in the calibration curve
- DL: Detection limit
- BEC: Background-equivalent concentration
- Units: Units of concentration
- Substitution: The peak that was used as the substitution for the calibration curve in the optional chromatographic analysis.
- Select a folder to export to, and enter a file name.
- Select the export file type from the [Save as type] list. The following
file formats are available:
- Excel (*.xlsx)
- Excel 97-2003 File (*.xls)
- Comma separated values (*.csv)
- Tab Delimited (*.txt)
However, you can select an Excel file only when the Excel is installed.
- Click <OK>.
Associated application starts, and then the calibration curve summary file opens.
Exporting calibration curves
Calibration curves can be exported in various graphics file formats. For more information, refer to “Exporting the graphs” under “Common Graph Operations”.