Data Analysis for Isotope Dilution Analysis
Isotope dilution (ID) is an analysis technique that is used when the highest accuracy is required. This ID method has high accuracy because it measures the concentration of isotope ratios, Isotope ratio concentration can be measured with far greater precision than the concentration of elements.
This section describes how to set the parameters for isotope dilution analysis and generate an isotope dilution analysis report.
- Data Analysis Procedure
- Loading data into the batch folder
- Sample type setup
- Creating a data analysis method for isotope dilution
- Executing analyses
- Checking/Correcting the analysis results for Isotope Dilution Analysis
- Saving the analysis results
- Generating the analysis results report
- Closing the data analysis window
Loading data into the batch folder
Open a Batch Folder, and load the data to be analyzed by completing the following steps.
You may also load the data after creating the Data Analysis Method.
- In the [ICP-MSICP-QQQ Data
Analysis] window, open a Batch Folder.
For information, refer to “Opening the Data Analysis window”, “Creating a batch folder”, and “Loading a batch result” under “Common Data Analysis Operations”.
- In the [ICP-MSICP-QQQ Data
Analysis] window, load the standard sample data, the background data,
and the unknown sample data.
For information, refer to “Loading the data” under “Common Data Analysis Operations”.
The data files are displayed in the Batch Table pane.
Sample type setup
Specify the sample type.
- Check that the correct sample types are displayed in the Type column of the Batch Table pane. If they are incorrect, change the setting.
Creating a data analysis method for isotope dilution
To create a Data Analysis Method for Isotope Dilution, follow these steps:
- Click [Edit] from the [Method] group on the [Home] tab.
The [Method Editor] window is displayed.

[Method Editor] Window
- On the Method
Development Tasks pane, click [Data Analysis Method] from the
[Set up Basic Information] group.
The Data Analysis Method pane is displayed.
Data Analysis Method Pane
- Configure the settings in the Data
Analysis Method table as follows:
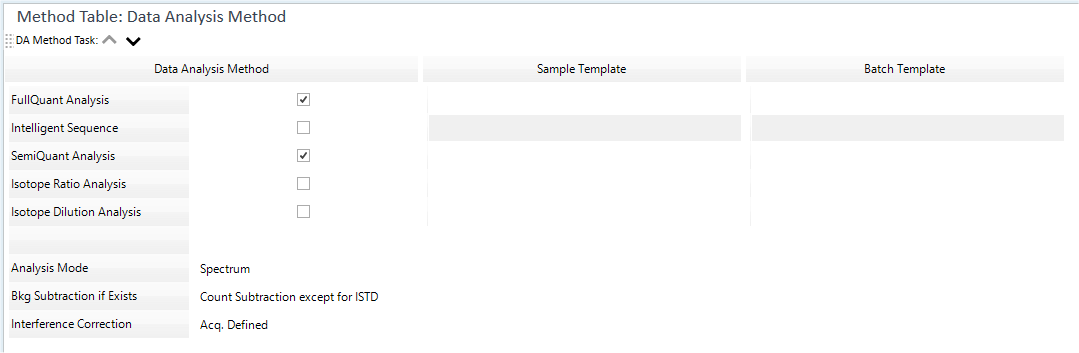
Data Analysis Method Table
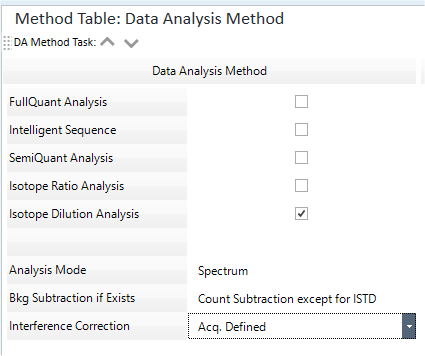
- Mark the check box for [Isotope Dilution Analysis].
- The [Analysis Mode] list displays the analysis mode for the acquired data. For isotope dilution analysis, check that “Spectrum” is selected.
- Select background subtraction from the [Bkg Subtraction if
Exists] list.
When [Bkg Subtraction if Exists] is checked, select “Bkgnd” for the sample type of the background sample.
For more information about these settings, refer to “Data Analysis Method table”.
- Click [Settings] from the [Settings] group on the [Tools] tab.
The [Settings] dialog box appears.
- Click [Open Designer] from the [Reporting] category.
Start the Report Designer software.
- Select [File] - [Open] to open "ID.analysis.acrt" in
the Isotope Dilution template.
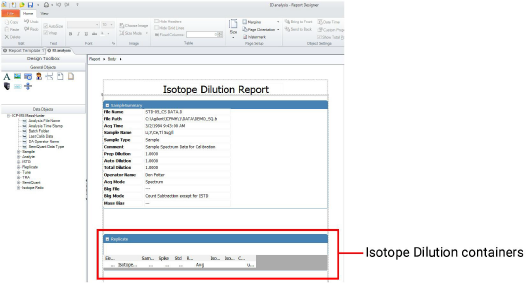
- Right click the table in the Isotope Dilution container, and then
select [Custom Properties].
The [Edit Table Properties] dialog box appears.
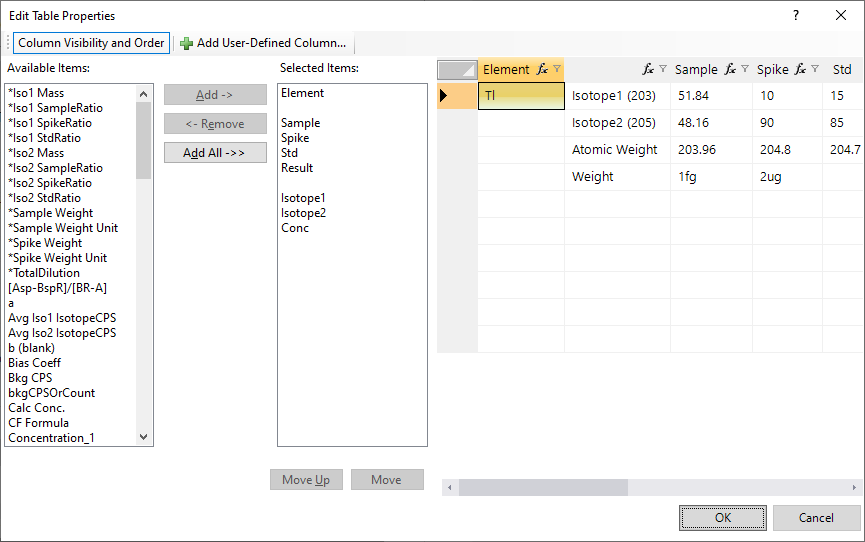
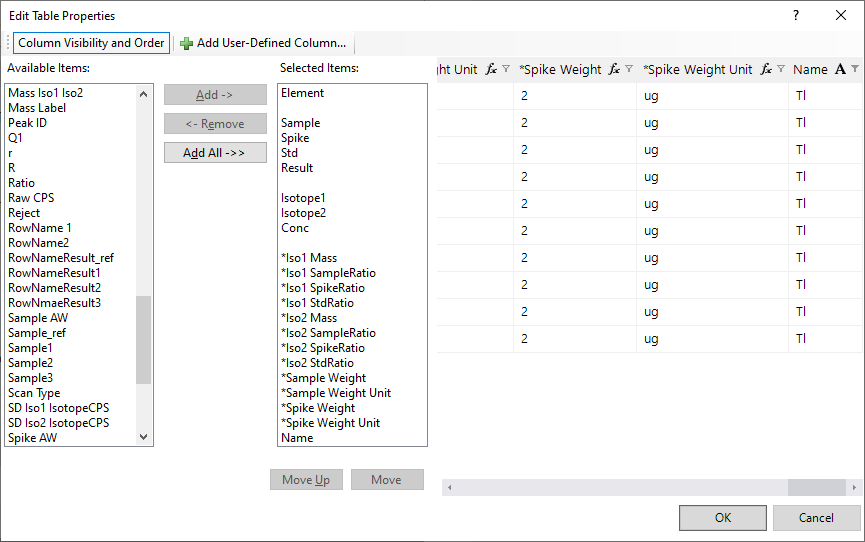
- Select an item that has an asterisk (*) in the [Available Items:]
list box.
[*Iso1 Mass]
[*Iso1 SampleRatio]
[*Iso1 SpikeRatio]
[*Iso1 StdRatio]
[*Iso2 Mass]
[*Iso2 SampleRatio]
[*Iso2 SpikeRatio]
[*Iso2 StdRatio]
[*Sample Weight]
[*Sample Weight Unit]
[*Spike Weight]
[*Spike Weight Unit]
[Name]
- Click [Add ->].
The item is added to the [Selected Item:] list box.
- Enter a number into each column. Enter as shown below.
- Click
 in the column to be entered.
The [User Defined Settings] dialog box appears.
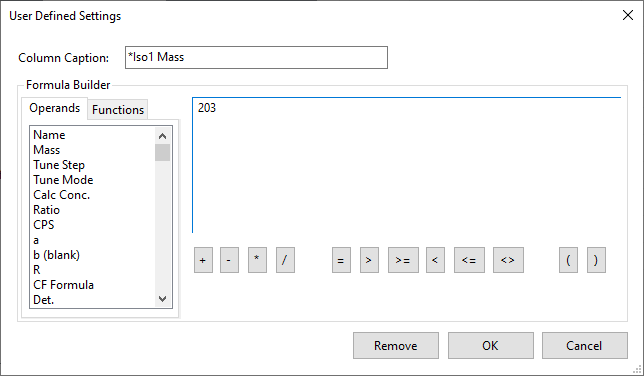
- Enter a number in each text box, and then click OK.
See the following table for the input values.
Type
Column
Input value
Isotope 1
[*Iso1 Mass] column
Enter the mass number for isotope 1.
[*Iso1 SampleRatio] column
Enter the isotope ratio for the sample's Isotope 1.
[*Iso1 SpikeRatio] column
Enter the isotope ratio for isotope1 that is authorized in the added spike.
[*Iso1 StdRatio] column
Enter the isotope ratio for isotope 1 that is contained in the standard solution file for the mass bias correction.
Isotope 2
[*Iso2 Mass] column
Enter the mass number for isotope 2.
[*Iso2 SampleRatio] column
Enter the isotope ratio for the sample's Isotope 2.
[*Iso2 SpikeRatio] column
Enter the isotope ratio for isotope 2 that is authorized in the added spike.
[*Iso2 StdRatio] column
Enter the isotopic ratio for isotope 2 that is contained in the standard solution file for the mass bias correction.
The weight (unit) of a sample and a spike
[*Sample Weight] column
Enter the quantity of the sample.
[*Sample Weight Unit] column
Enter the unit for the volume of the sample within inverted commas. For example, when you want to enter fg as the unit, enter 'fg'.
[*Spike Weight] column
Enter the quantity of the spike.
[*Spike Weight Unit] column
Enter the unit for the volume of the spike within inverted commas.
- Click
- Follow the steps below to populate the target element in the table.
- Click
 in the [Name] column, and then select [Custom].
The [Custom Filter] dialog box appears.
- Make the following settings, and then click [OK].
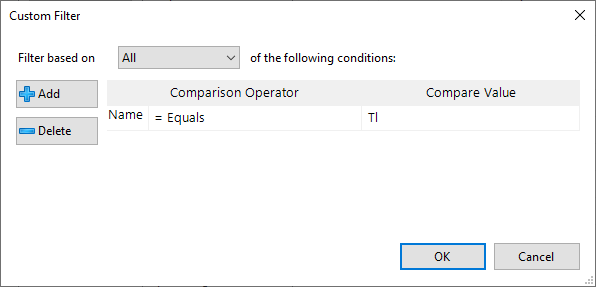
- Select [Filter based on]: [All]
- Select [Compare Operator]: [= Equals]
- [Compare Values]: Enter the symbol for the target element
- Select the following items in the [Selected Item:] list box,
and then click [Delete ->].
[*Iso1 Mass]
[*Iso1 SampleRatio]
[*Iso1 SpikeRatio]
[*Iso1 StdRatio]
[*Iso2 Mass]
[*Iso2 SampleRatio]
[*Iso2 SpikeRatio]
[*Iso2 StdRatio]
[*Sample Weight]
[*Sample Weight Unit]
[*Spike Weight]
[*Spike Weight Unit]
[Name]
The items listed above are deleted from the [Selected Item:] list box.
- Click
- Click [OK].
- Check that the output is correct in the Live Preview pane.
- Select [File] - [Save as] to save the template with a different name.
- Click
 [Print Report] or
  [Save Report to PDF] icon to
output the report if necessary.
[Save Report to PDF] icon to
output the report if necessary. - Close the Report Designer.
- Specify the new template in the Sample/Batch Template Table.
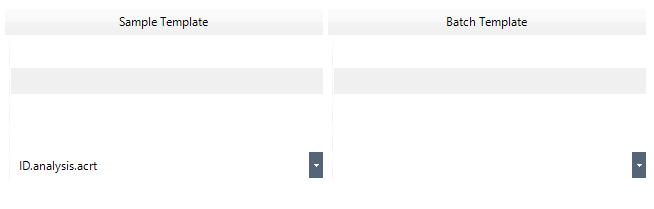
Sample/Batch Template Table
The rows of the Sample/Batch Template table correspond to the rows of the Data Analysis Method table. Specify a template in the box on the same row of the selected Data Analysis Method.
For information, refer to “Sample/Batch Template table”.
- Configure the following settings as necessary:
To set up a Worklist and configure custom actions and auto-saving of analysis results report:
On the Method Development Tasks pane, click [Worklist Actions] from the [Advanced Info] group. The Work List Actions pane is displayed for setting the Worklist.
For information on these settings, refer to “Work List Actions pane”.
- On the Method
Development Tasks pane, click [Validate] from the [Validate/Return]
group.
If an error is found in the Data Analysis Method, the error information is displayed in the Method Error List pane. Correct the error.
If no error is found, a confirmation dialog box is displayed.
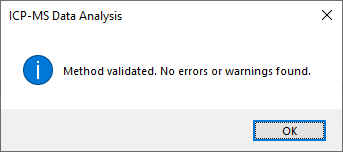
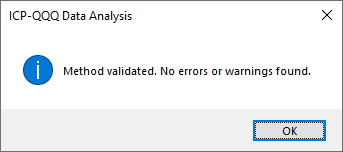
Confirmation Dialog Box
- Click <OK>.
- On the Method Development Tasks pane, click [Return to Batch-at-a-Glance] from the [Validate/Return] group.
- When asked whether to update the Data
Analysis Method, click <Yes>.
Proceed to the analysis process.
In the following steps, the two isotopes for the analyte are known as "isotope 1" and "isotope 2".
ICP-MSICP-QQQ does not have the same sensitivity for all masses. A mass bias (difference in sensitivity between masses) may occur at an interface, ion lens, mass filter, and/or detector. Mass bias is more severe at lower masses, where the percentage of mass difference between adjacent masses is greater. In general, however, mass bias is relatively constant and can easily be corrected by using a standard sample.
Executing analyses
If a new Data Analysis Method was created or the settings were changed, do an analysis. To run an analysis, follow these steps:
- Click [Process Batch] from the [Batch Option] group on the [Home]
tab.
Analysis is performed using the settings in the Data Analysis Method.
Proceed to Checking/Correcting the analysis results.
Checking/Correcting the analysis results for Isotope Dilution Analysis
Analysis reports are not displayed in the Batch Table.
To check the analysis results, first generate the analysis results report.
Saving the analysis results
For more information, refer to “Saving the analysis results” under “Common Data Analysis Operations”.
Generating the analysis results report
For more information, refer to “Generating the analysis results report” under “Common Data Analysis Operations”.
Closing the data analysis window
For more information, refer to “Closing the Data Analysis window” under “Common Data Analysis Operations”.