Data Analysis for Isotope Ratio Analysis
Isotope ratio analysis is used primarily for geological and nuclear applications, such as to determine the age and origin of geological samples and to measure uranium enrichment.
This section explains procedures that are used to create a data analysis method for isotope ratio analysis, performing the analysis, and check the analysis results.
- Data Analysis Procedure
- Loading data into the batch folder
- Sample type setup
- Creating a data analysis method for isotope ratio analysis
- Executing analyses
- Checking/Correcting the analysis results for Isotope ratio analysis
- Saving the analysis results
- Generating the analysis results report
- Closing the Data Analysis window
For formulas see: Reference > Equations > Performing an Isotope Dilution Analysis.
Loading data into the batch folder
Open a Batch Folder, and load the acquired data to be analyzed by completing the following steps.
You may also load the data after you create the Data Analysis method.
- In the [ICP-MSICP-QQQ
Data Analysis] window, open a Batch Folder.
For more information, refer to “Opening the Data Analysis window”, “Creating a batch folder”, and “Loading a batch result” under “Common Data Analysis Operations”.
- In the [ICP-MSICP-QQQ Data
Analysis] window, load the standard sample, the background data, and
the unknown sample data.
For more information, refer to “Loading the data” under “Common Data Analysis Operations”.
The data files are displayed in the Batch Table pane.
Sample type setup
Specify the sample type.
- Check that the correct sample
types are displayed in the Type column of the Batch
Table pane. If they are incorrect, change the setting.
- Background sample (for background subtraction): Bkgnd
- Standard sample for isotope ratio analysis (for mass bias correction): IsoStd
- Unknown sample: Sample
Creating a data analysis method for isotope ratio analysis
To create a Data Analysis Method for Isotope Ratio analysis, follow these steps:
- Click [Edit] from the [Method] group on the [Home] tab.
The [Method Editor] window is displayed.

[Method Editor] Window
- On the Method
Development Tasks pane, click [Data Analysis Method] from the
[Set up Basic Information] group.
The Data Analysis Method pane is displayed.
Data Analysis Method Pane
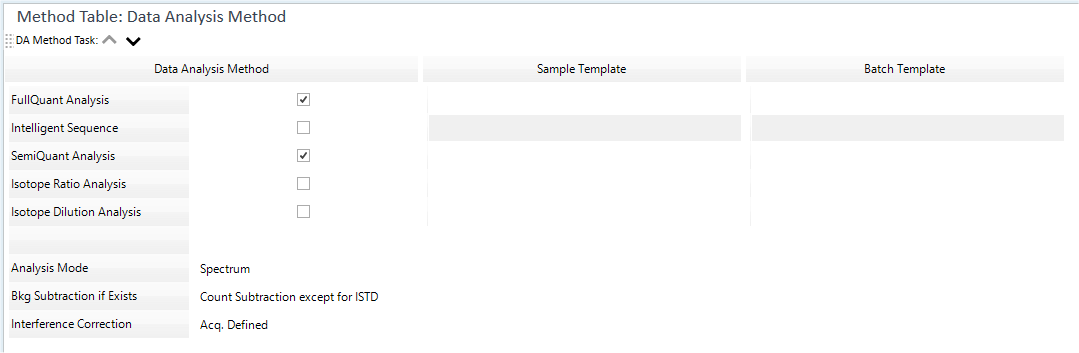
- Configure the settings in the Data
Analysis Method pane as follows:
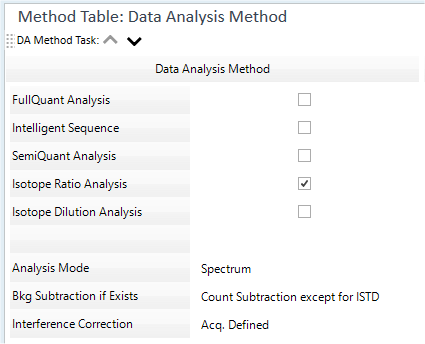
Data Analysis Method Table
- Mark the check box for [Isotope Ratio Analysis].
The [Analysis Mode] list displays the analysis mode for the acquired data. For isotope ratio analysis, check that “Spectrum” is selected.
Select background subtraction from the [Bkg Subtraction if Exists] list.
When [Bkg Subtraction if Exists] is marked, select “Bkgnd” for the sample type of the background sample.
For information on these settings, refer to “Data Analysis Method table”.
- In the Sample/Batch
Template table, configure the template for the analysis results
report.
There are two types of templates:
- Sample Template: Report of sample data
- Batch Template: Report of the entire batch
Click the
 on the right end of the box
to select a template, as necessary.
on the right end of the box
to select a template, as necessary.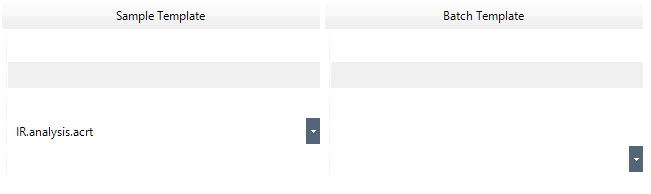
Sample/Batch Template Table
The rows of the Sample/Batch Template table correspond to the rows of the Data Analysis Method table. Specify a template in the box on the same row of the selected Data Analysis Method.
For more information, refer to “Sample/Batch Template table”.
- On the Method
Development Tasks pane, click [Isotope Ratio] from the [Set up
Analysis Parameters] group.
The Isotope Ratio pane is displayed.
Isotope Ratio Pane
- If the analytes are not listed in the Isotope
Ratio pane as follows:
- Click
 to
open the [Elements]
dialog box to add new analytes.
to
open the [Elements]
dialog box to add new analytes.
Place the cursor at the beginning of the line and select [Add Numerator Row] from the context menu to set multiple numerators for one element.
- Click
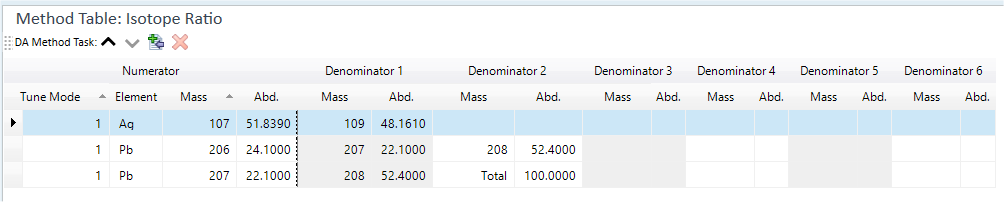
- In the Isotope
Ratio pane, set the isotope ratio parameters.
- Select the Tune Mode.
- Select the mass in the numerator column for the isotope.
- Specify the mass for the denominator to be used to calculate the isotope ratio. The stable isotope ratio is displayed automatically.
- Select a scan type.
- Select the masses of Q1 and Q2 in the numerator column of the isotope ratio to be obtained.
- Set the masses of Q1 and Q2 in the denominator column to used to calculate the isotope ratio. A stable isotope is automatically displayed.
For more information, refer to “Isotope Ratio pane”.
- Configure the following settings as necessary:
- To set a worklist and configure custom actions and auto-saving
of analysis results report:
On the Method Development Tasks pane, click [Worklist Actions] from the [Advanced Info] group. The Work List Actions pane is displayed for setting up the Worklist.
For more information about these settings, refer to “Work List Actions pane” help topic.
- To set a worklist and configure custom actions and auto-saving
of analysis results report:
- On the Method
Development Tasks pane, click [Validate] from the [Validate/Return]
group.
If an error is found in the Data Analysis Method, the error contents are displayed in the Method Error List pane. Correct the error.
If no error is found, a confirmation dialog box is displayed.
Confirmation Dialog Box
- Click <OK>.
- On the Method Development Tasks pane, click [Return to Batch-at-a-Glance] from the [Validate/Return] group.
- When asked whether to update the Data
Analysis Method, click <Yes>.
Proceed to the analysis process.
Executing analyses
If a new Data Analysis Method was created or the settings were changed, do an analysis. To run an analysis, complete the following step:
- Click [Process Batch] from the [Batch Option] group on the [Home]
tab.
Performs an analysis using the settings in the Data Analysis Method and displays the analysis results in the Batch Table pane.
Proceed to Checking/Correcting the analysis results.
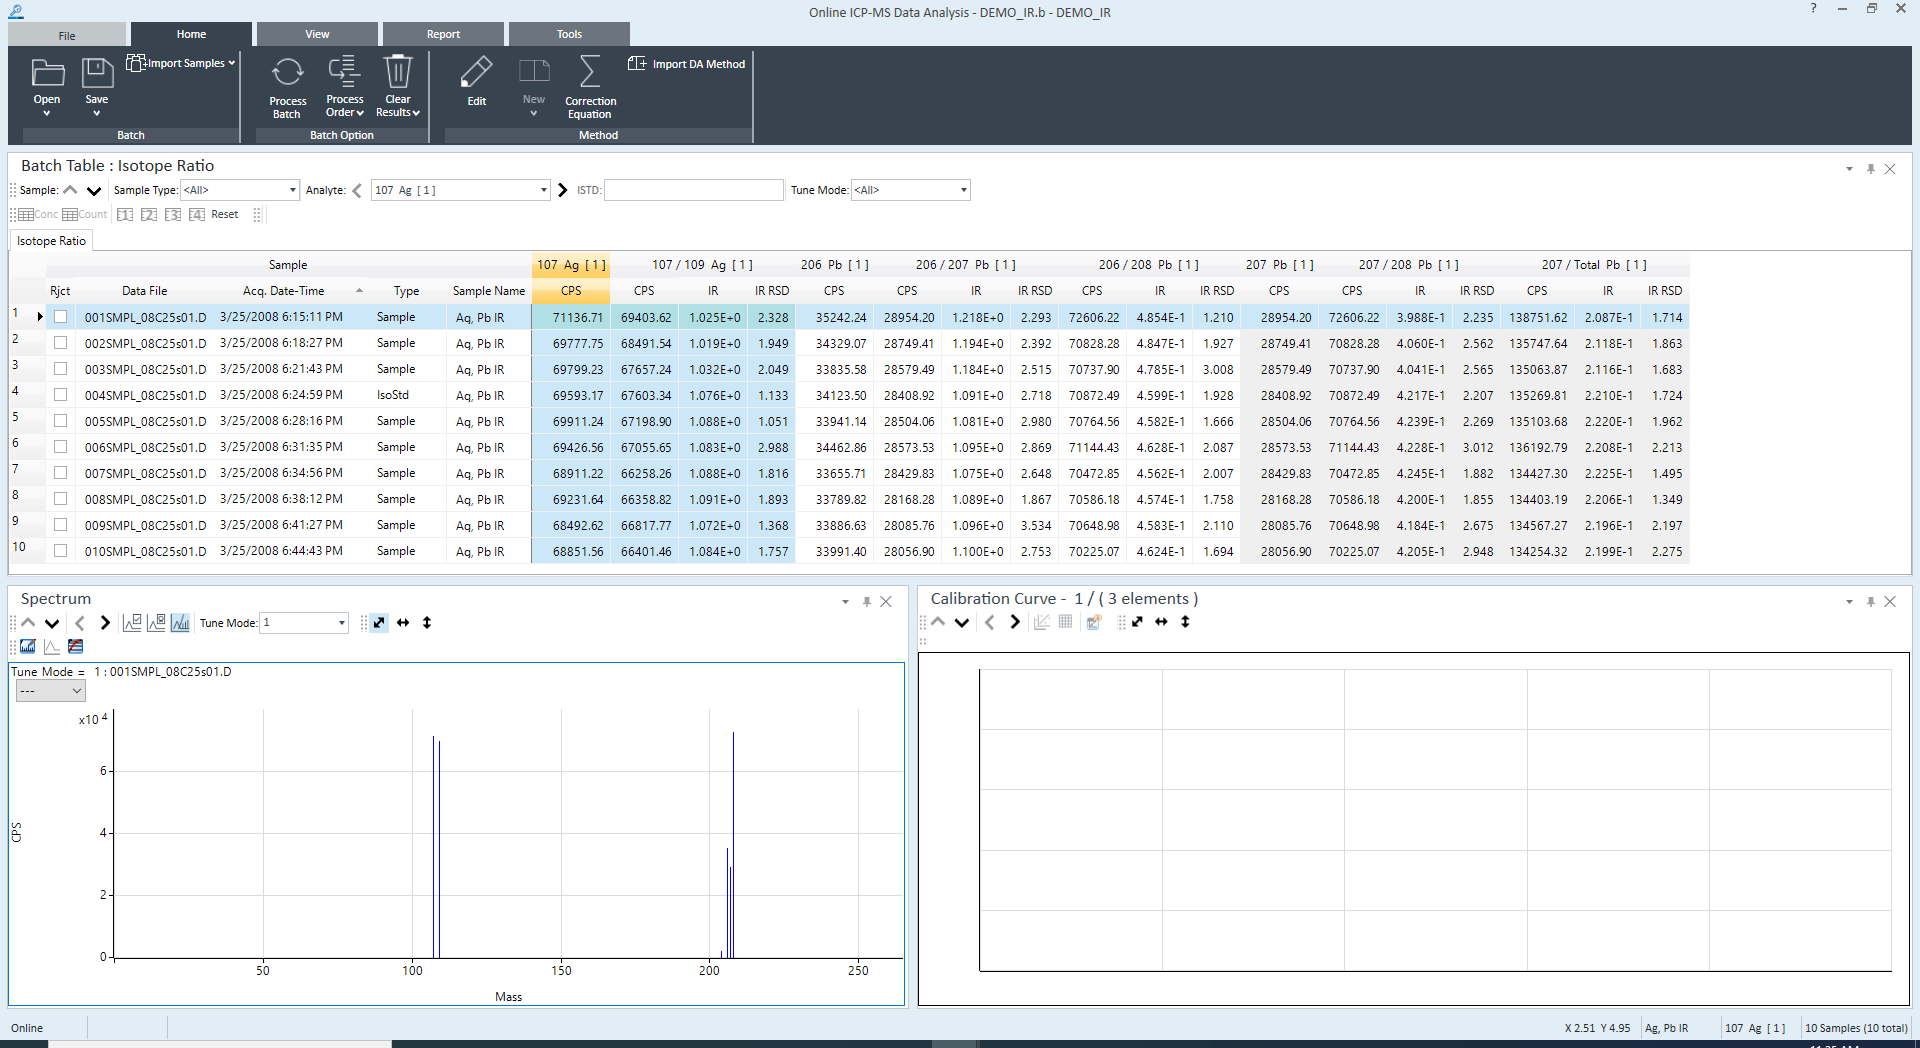
Analysis Result
Checking/Correcting the analysis results for Isotope ratio analysis
For isotope ratio analysis, check the following:
This section explains the procedures used to check and correct the analysis results.
Checking the Batch Table
The Batch Table pane for isotope ratio analysis displays the count (CPS column) per second of the expected isotope and the isotope ratio (IR column).
In this explanation, the following condition is assumed: in the Isotope Ratio pane under analysis method, the numerator (isotope ratio) is set to 107 Ag. The denominator (isotope ratio) is set to 109 Ag. The “Total”, in this case, represents the total of Ag(107) and Ag(109).
After the analysis is performed, the Batch Table displays the count
(CPS column) per second
of Ag(107), ![]() ,
, ![]() ,
and the isotope ratio (IR column).
,
and the isotope ratio (IR column).
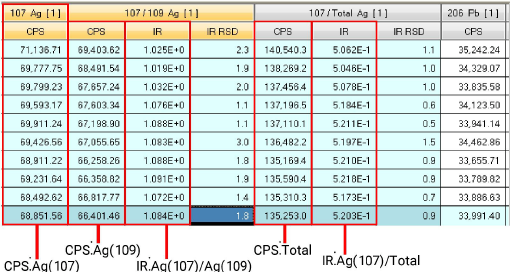
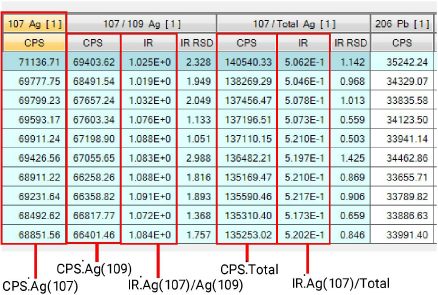
IR Analysis Batch Table
When the cursor is moved near the column header, a tool tip displays the meaning of the numeric value. (Example: 109Ag, 107/109Ag)
For more information, refer to the “Isotope Ration Analysis Column Functions”.
For information on viewing and using the Batch Table pane, refer to “Batch Table Pane Operation”.
Isotope Ratio Analysis Column Functions
In the Isotope Ratio Analysis Batch Table, each row represents a sample, with the columns displaying information on the samples and elements.
The columns are separated into five categories: sample name, numerator, denominator, replicate numerator, and replicate denominator.
- Sample Column
Displays information on a sample, such as the data file name, sample type, and sample name.
- Numerator column
Displays the CPS (counts per second), Abd (abundance ratio), and CPS RSD (relative standard deviation) of the isotope (numerator).
- Denominator column
Displays the CPS (counts per second), IR (isotope ratio), Abd (abundance ratio), CPS RSD (relative standard deviation), IR RSD, and mass bias of the isotope (denominator).
- Replicate numerator column
Displays the CPS of the replicated isotope data (numerator).
This column is not displayed by default.
- Replicate denominator column
Displays the CPS and IR (isotope ratio) of the replicated isotope data (denominator).
This column is not displayed by default.
This section covers columns that are not shown by default. To display these columns, refer to “ Adding/Removing columns” under “ Customizing columns”.
This section describes the content and function of the columns that are displayed in the Isotope Ratio Analysis Batch Table.
Sample Column
The sample column is the same as in other analysis modes. Refer to “Sample Column” in “Column Functions” under “Batch Table Pane Operation”.
Numerator Column
Displays the analysis results for an isotope (numerator).
The column headers display the mass, element name, and Tune Mode. After an analysis is performed, the CPS and Abd (abundance ratio) for each Tune Mode is displayed for the elements in each sample. For replicated measurement data, the average is displayed.
The subcolumns are described below.
- CPS Column
Displays the CPS (counts per second) for the isotope (numerator).
- Abd Column
Displays the abundance ratio for an isotope (numerator).
- CPS RSD Column
Displays the relative standard deviation (%) of the CPS for an isotope (numerator).
Denominator Column
Displays the analysis results for an isotope (denominator).
The column headers display the mass of the isotope (numerator)/mass of the isotope (denominator), element name, and Tune Mode. After an analysis is performed, the CPS and Abd (abundance ratio) for each Tune Mode is displayed for the elements in each sample. For replicated measurement data, the average is displayed.
The subcolumns are described below.
- CPS Column
- IR Column
Displays the isotope ratio for two isotopes.
- Abd Column
Displays the abundance ratio for two isotopes.
- CPS RSD Column
Displays the relative standard deviation (%) of the CPS for an isotope (denominator).
- IR RSD Column
Displays the relative standard deviation (%) of the isotope ratio.
- Mass Bias Factor Column
Displays the mass bias correction factor.
Displays the CPS for an isotope (denominator).
ICP-MSICP-QQQ does not have the same sensitivity for all masses. A mass bias (difference in sensitivity between masses) may occur at an interface, ion lens, mass filter, and/or detector. Mass bias is more severe at lower masses, where the percentage of mass difference between adjacent masses is greater. In general, however, mass bias is relatively constant and can easily be corrected by using a standard sample (sample type: IsoStd).
Replicate numerator column
Displays the replicated isotope data (numerator). These columns are not displayed by default. Add the column using “Add/Remove Columns”, if necessary.
The column headers display the mass, element name, and Tune Mode of the isotope (numerator). After an analysis is performed, the CPS for each Tune Mode is displayed for the replicated element data in each sample.
The subcolumns are described below.
- CPS Column
Displays the CPS of the replicated isotope data (numerator).
Replicate Denominator Column
Displays the replicated isotope data (denominator). These columns are not displayed by default. Add the column using “Add/Remove Columns”, if necessary.
The subcolumns are described below.
- CPS Column
Displays the CPS of the replicated isotope data (denominator).
- IR Column
Displays the replicated data of the isotope ratio.
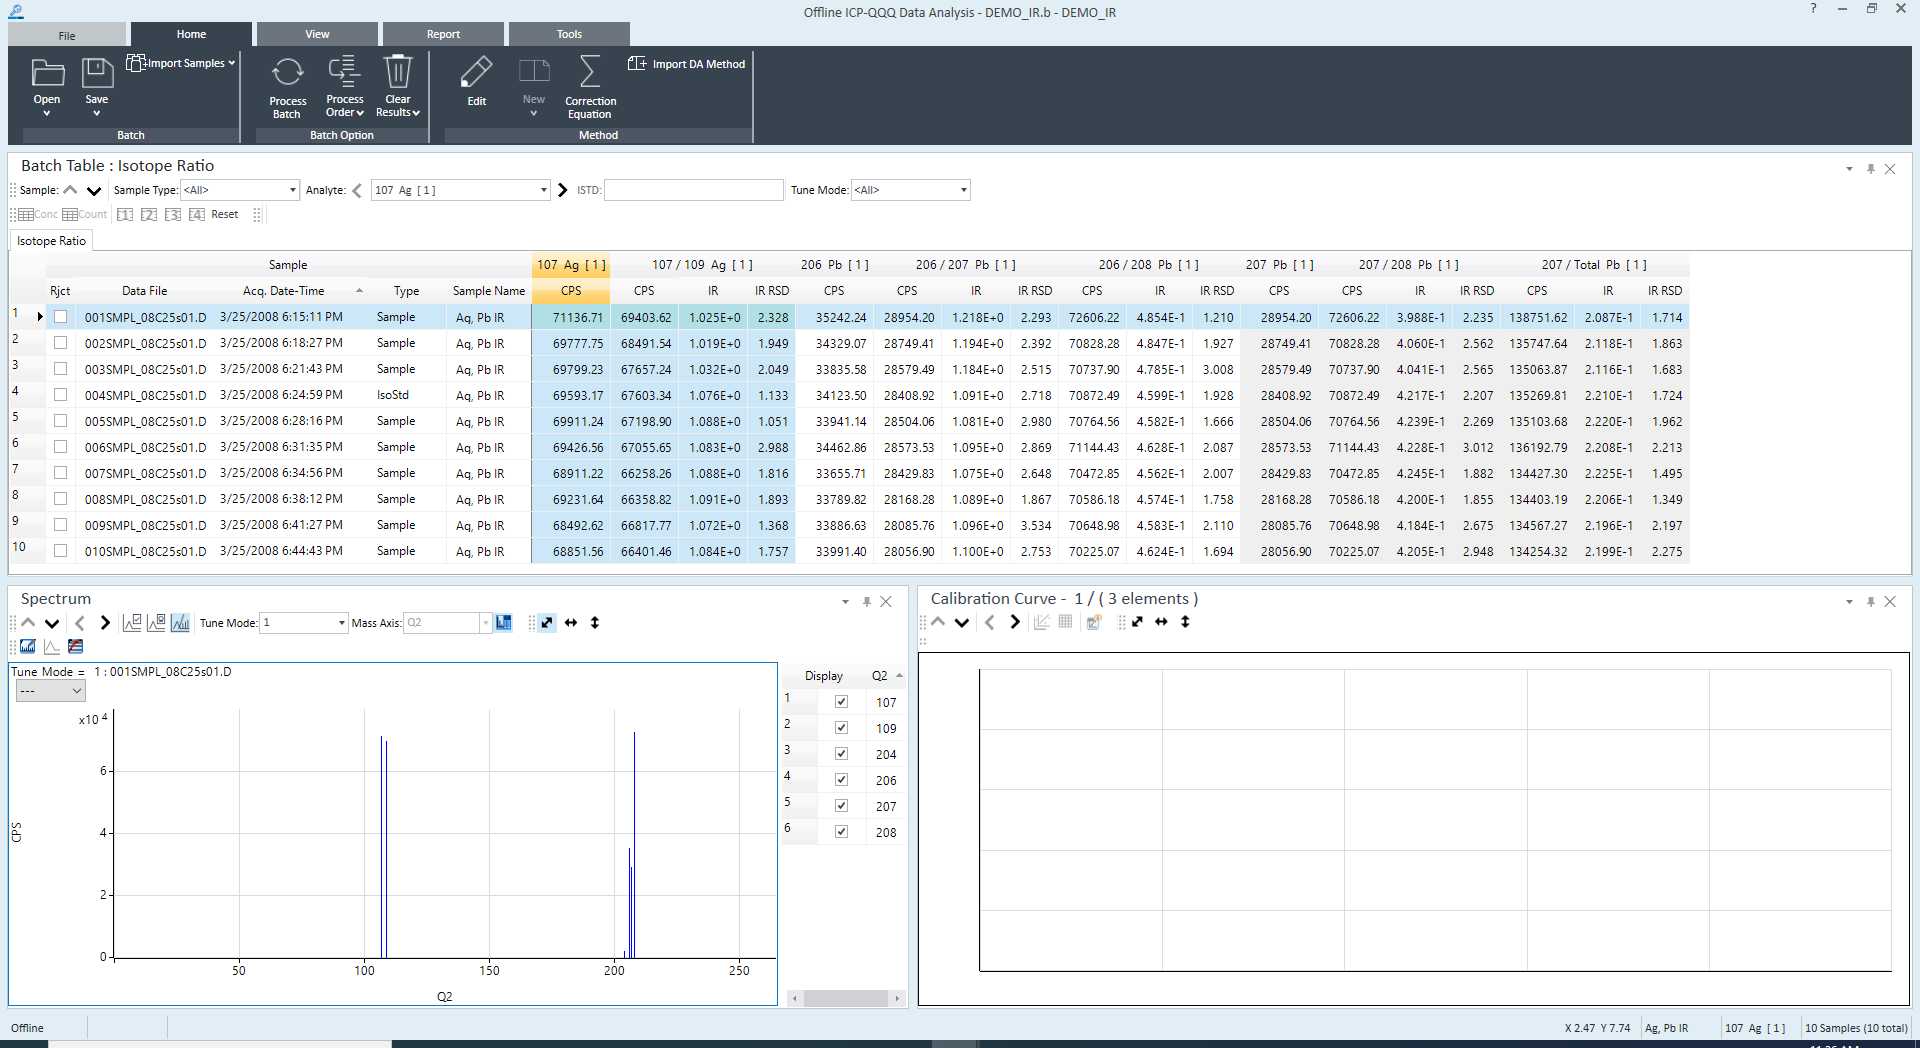
Checking the spectrum pane
The Spectrum pane lets you check the spectrum of the isotope.
For information on viewing and using the Spectrum pane, refer to “Spectrum Pane Operation”.
Saving the analysis results
For more information, refer to “Saving the analysis results” under “Common Data Analysis Operations”.
Generating the analysis results report
For more information, refer to “Generating the analysis results report” under “Common Data Analysis Operations”.
Closing the Data Analysis window
For more information, refer to “Closing the Data Analysis window” under “Common Data Analysis Operations”.