Particle Size Distribution Pane (Option)
This section describes the function of the commands that are available in the Particle Size Distribution pane (Option), which is displayed when you analyze samples with the optional Single Particle Analysis software.
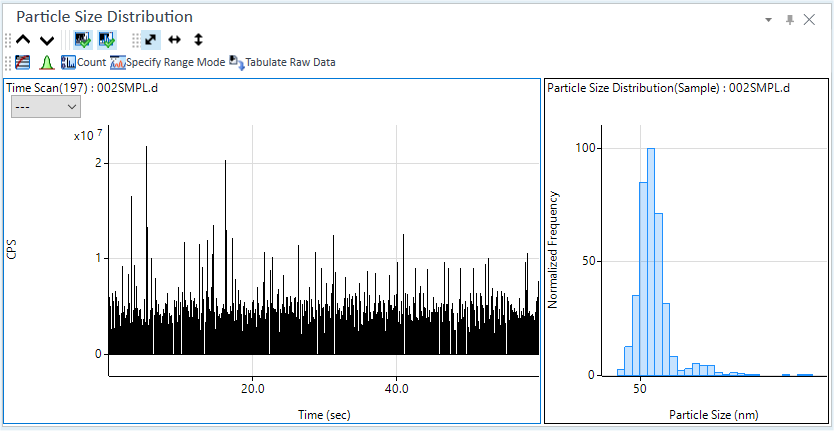
This pane displays both Time Scan data and calculated Particle Size Distribution charts of current focused sample on batch table.
For more detailed operations, refer to ”Particle Size Distribution Pane Operations”.
- Title Bar
- Single Particle Distribution Toolbar
- Zoom (Particle Size Distribution) Toolbar
- Functions (Single Particle Distribution) Toolbar
- Scale Dropdown List
- Time Scan Chart
- Particle Size Distribution Chart
- Context Menu
- To Get Here
Title Bar
The title bar buttons and the context menu have the same functions as the Title Bar of the Instrument Status Pane.
Single Particle Distribution Toolbar
 Drag to move the toolbar.
 Displays the
graph for the previous sample.
Displays the
graph for the previous sample.
 Displays the graph for the next sample.
 Displays or hides
the Time Scan Chart.
Displays or hides
the Time Scan Chart.
 Displays or hides the Particle Size Distribution
Chart.
Displays or hides the Particle Size Distribution
Chart.
Zoom (Particle Size Distribution) Toolbar
The Zoom Toolbar have the same functions as the Zoom Toolbar of the Spectrum pane.
Functions (Single Particle Distribution) Toolbar

 Changes the display between log scale and linear
scale.
Changes the display between log scale and linear
scale.
 Displays the baseline on the time scan chart. You
can specify the baseline by dragging or double clicking. The signal is
re-integrated using the specified baseline.
Displays the baseline on the time scan chart. You
can specify the baseline by dragging or double clicking. The signal is
re-integrated using the specified baseline.
 Only available when Time Scan Chart is displayed.
Changes between Count view
and CPS view.
Only available when Time Scan Chart is displayed.
Changes between Count view
and CPS view.
 Only available
when Time Scan Chart is displayed. While turning on this button, user
can select time range visually in Time scan chart for calculation of particle
size distribution. The selected range is indicated by purple-colored rectangle
on Time Scan Chart. Even if this button is turned off, the selected time
range is used for calculation. Default range is entire range of raw data
of Time Scan Chart.
Only available
when Time Scan Chart is displayed. While turning on this button, user
can select time range visually in Time scan chart for calculation of particle
size distribution. The selected range is indicated by purple-colored rectangle
on Time Scan Chart. Even if this button is turned off, the selected time
range is used for calculation. Default range is entire range of raw data
of Time Scan Chart.
 Exports the
raw data to a CSV file, and then opens the CSV file.
Exports the
raw data to a CSV file, and then opens the CSV file.
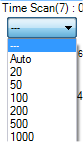
Scale Dropdown List
Lets you set the scale of the Y-axis.
Time Scan Chart
Displays the Time Scan Chart of the sample selected in the Batch Table.
Particle Size Distribution Chart
Displays the Particle Size Distribution Chart calculated from the Single Particle Analysis.
Context Menu
This section describes the commands that are available in the context menu, which is displayed when you right-click in the pane. The commands that are not listed below have the same function as their counterparts on the toolbars and the Ribbon.
[Count Display Mode]
Displays or hides the tooltip display for the Count value.
[Annotate]
[Add/Remove Annotation]
Opens the [Add comment] dialog box where you can add comments to the graph. To clear a comment, click this icon, and then click the comment on the graph.
[Save Annotation in Data]
Click this item to save the contents of annotations in a batch after you have written annotations.
[Tabulate Chart]
[Raw Data to CSV]
Exports the raw data to a CSV file, and then opens the CSV file.
[CPS Data to CSV]
Exports the CPS data to a CSV file, and then opens the CSV file.
[Tabulate Chart Data to CSV]
Exports the “Frequency Vs Particle Size” data to a CSV file, and then opens the CSV file.
[Copy]
Copies the selected data to the Clipboard. When a graphics pane is selected, the graphics are copied.
[Page Setup]
Opens the [Page Setup] dialog box for configuring the page settings for printing.
[Print]
Opens the [Print] dialog box where you can print the contents of the selected pane.
[Print Preview]
Opens the [Print Preview] dialog box where you can display the print preview.
[Export Graphics]
Opens the [Export Graphics] dialog box where you can export the graphics data. This command is available when a pane that includes graphics is selected.
To Get Here
- Open the single particle analysis batch result in the [ICP-MSICP-QQQ Data Analysis] window.
- Select [Panes] - [Particle Size Distribution] from the [Show] group on the [View] tab in the [ICP-MSICP-QQQ Data Analysis] window.