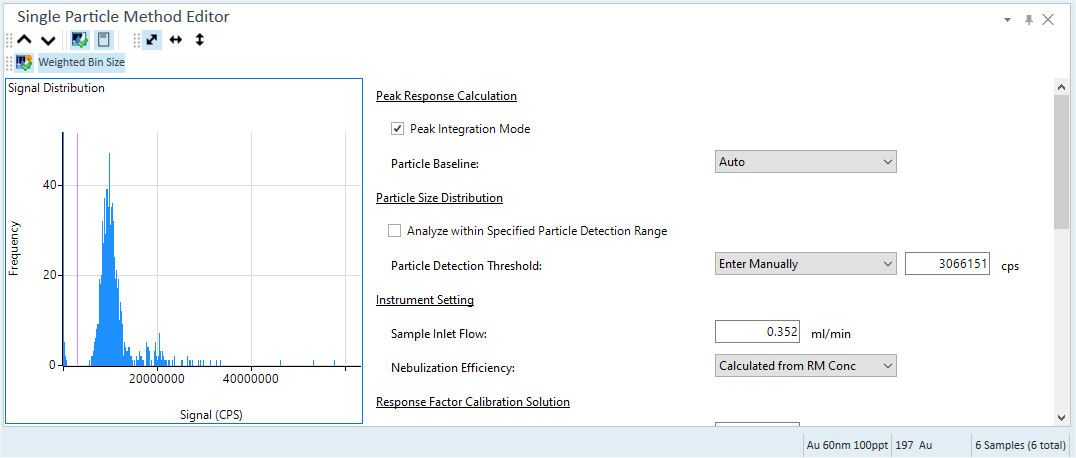
Single Particle Method Editor Pane (Option)
This section describes the function of the commands that are available in the Single Particle Method Editor pane (Option), which is displayed when you analyze samples with the optional Single Particle Analysis software.
This pain displays the Method Editor that allows you to display and change each parameter for Signal Distribution chart and Single Particle Analysis in samples selected from the batch table.
For more detailed operations, refer to ”Single Particle Method Editor Pane Operations”.
- Title Bar
- Single Particle Method Toolbar
- Zoom (Single Particle Method) Toolbar
- Functions (Single Particle Method) Toolbar
- Signal Distribution Chart
- Context Menu
- Method Editor
- To Get Here
Title Bar
The title bar buttons and the context menu have the same functions as the Title Bar of the Instrument Status Pane.
Single Particle Method Toolbar

 Drag to move the toolbar.
 Displays the
graph for the previous sample.
Displays the
graph for the previous sample.
 Displays the graph for the next sample.
 Displays or
hides the Signal Distribution chart.
Displays or
hides the Signal Distribution chart.
 Displays or
hides the Method Editor.
Displays or
hides the Method Editor.
Zoom (Single Particle Method) Toolbar
The Zoom Toolbar have the same functions as the Zoom Toolbar of the Spectrum pane.
Functions (Single Particle Method) Toolbar

 When this
is on, a vertical line in a different color is displayed which indicates
the currently selected threshold.
When this
is on, a vertical line in a different color is displayed which indicates
the currently selected threshold.
 This is displayed
if “Analyze within Specified Particle Detection Range” is enabled. When
this button is enabled, you can specify the range by dragging the particle
detection range in the Signal Distribution Chart.
This is displayed
if “Analyze within Specified Particle Detection Range” is enabled. When
this button is enabled, you can specify the range by dragging the particle
detection range in the Signal Distribution Chart.
The selected range is indicated by a purple-colored rectangle on Signal
Distribution Chart.
 When
selected, a wider bin size is used according to the strength of the signal.
When not selected, the bin size is fixed by CPS which is the equivalent
of a 1 count. It is useful when you set a threshold manually.
When
selected, a wider bin size is used according to the strength of the signal.
When not selected, the bin size is fixed by CPS which is the equivalent
of a 1 count. It is useful when you set a threshold manually.
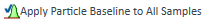 Displays samples in which “Enter Manually” is selected
for the particle baseline. Click to apply the current particle baseline
value to all samples. However, you cannot use it for the calibration category
sample type (IonicBlk, IonicStd (AN) and IonicStd (RM)).
Displays samples in which “Enter Manually” is selected
for the particle baseline. Click to apply the current particle baseline
value to all samples. However, you cannot use it for the calibration category
sample type (IonicBlk, IonicStd (AN) and IonicStd (RM)).
Signal Distribution Chart
This is calculated from raw data of current focused sample on batch table.
Context Menu
This section describes the commands that are available in the context menu, which is displayed when you right-click in the pane. The commands that are not listed below have the same function as their counterparts on the toolbars and the Ribbon.
[Tabulate Chart Data to CSV]
Exports the “Frequency Vs Particle Size” data to a CSV file, and then opens the CSV file.
[Apply Particle Detection to All Samples]
Applies the parameters in the [Particle Size Distribution] category for the current selected sample to all samples. However, you cannot use it for the calibration category sample type (IonicBlk, IonicStd (AN) and IonicStd (RM)). Also, you cannot use it when measuring in the "2 Elements / Isotopes" mode.
[Copy]
Copies the selected data to the Clipboard. When a graphics pane is selected, the graphics are copied.
[Page Setup]
Opens the [Page Setup] dialog box for configuring the page settings for printing.
[Print]
Opens the [Print] dialog box where you can print the contents of the selected pane.
[Print Preview]
Opens the [Print Preview] dialog box where you can display the print preview.
[Export Graphics]
Opens the [Export Graphics] dialog box where you can export the graphics data. This command is available when a pane that includes graphics is selected.
Method Editor
Displays each parameter for Single Particle Analysis and allows you to make changes.
Peak Response Calculation
Peak Integration Mode
Sums the signal for several adjacent integration times to integrate the total signal for a particle event (peak) when the integration time is shorter than the particle event duration. This should be enabled for integration times of 0.1 or 0.2 ms, but not for longer integration times.
Particle Baseline
Select [Auto] or [Enter Manually] as the particle baseline. [Auto] calculates the baseline automatically. [Enter Manually] allows you to specify the baseline for each sample by entering a baseline value (CPS) into the text box.
By clicking the icon, you can display the baseline
on the time scan panel.
However, you cannot use it for the calibration category sample type (IonicBlk, IonicStd (AN) and IonicStd (RM)).
Particle Size Distribution
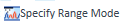
Analyze within Specified Particle Detection Range
The user can specify the range in which signals can be handled as particles on the method panel. The default setting is off. When this is cleared, you can select [Auto] or [Enter Manually] as the [Particle Detection Threshold].
When this is selected, you can specify the range of the signal in [Particle Detection Range], or you can specify the range on the Signal Distribution chart by selecting the [Specify Range Mode] icon on the toolbar.
The range can also be reported. If this item is off, the value is displayed as “N/A”.
Particle Detection Threshold
The limit value that separates particles from noise and ions.
This is displayed when [Analyze within Specified Particle Detection] is cleared, and it allows you to select [Auto] or [Enter Manually]. When you select [Auto], the Particle Detection Range is calculated automatically. When you select [Enter Manually], you can specify the Particle Detection Range manually.
Particle Detection Range
Range where separates particles from noise and ions.
This is displayed when [Analyze within Specified Particle Detection Range] is selected, and it allows you to specify the Particle Detection Range.
Instrument Setting
Sample Inlet Flow
The sample flow into ICP-MS expressed in ml/min.
The default value is calculated from acquisition parameter.
When a batch is created in Method Wizard, it is calculated from the Sample Pump Tube ID entered in Method Wizard. You can also calculate it using the [Agilent ICP-MS Flow and Dilution Factor Calculator] dialog box and enter manually.
Nebulization Efficiency
Select a selection method of the Nebulization Efficiency from [Calculated from RM Conc.], [Calculated from RM Size], or [Enter Manually]. When you select [Enter Manually], enter Nebulization Efficiency to the text box.
Response Factor Calibration Solution
Response at XXX amu
Response of an ion standard of the element that the particle to be measured is made of.
This can be acquired by the user in the [Response Factor Calibration] dialog box.
If a batch contains an ”IonicStd (AN)“ sample, Data Analysis calculates Response Factor using the sample and sets ”Ionic Standard Concentration“ as the Data Analysis method.
If ”IonicStd (AN)“ is acquired before the sample, the Response Factor calculated from the ”IonicStd (AN)“ is used for the sample. The Response Factor from the Data Analysis method is set as the value. Otherwise, the Response Factor specified in this field is used for Single Particle Analysis.
If ”IonicBlk“ is acquired in before the ”IonicStd (AN)”, the Response Factor (RF) is calculated as:
RF = (Average CPSIonicStd (AN) - Average CPSIonicBlk)/Specified Conc
RF is a slope calculated from two calibration points with a Blank.
Ionic Standard Concentration
Input a concentration of Ionic Standard. The default value is 1 ppb.
Reference Material
Reference Element Mass
Displays the mass number for the standard element in Reference Material.
Reference Element Response Factor
This item is displayed only when you select [Calculated from RM Size] in [Nebulization Efficiency].
Nebulization Efficiency, ![]() ,
is calculated based on the size as:
,
is calculated based on the size as:
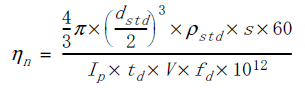
Where ![]() is the standard
particle diameter (nm),
is the standard
particle diameter (nm), ![]() is
the element density of RM sample (g/ml), s is
the response factor (cps/ppb),
is
the element density of RM sample (g/ml), s is
the response factor (cps/ppb), ![]() is
the Integration Time (sec), V is the
sample inlet flow (ml/min),
is
the Integration Time (sec), V is the
sample inlet flow (ml/min), ![]() is
the molar mass particle / molar mass analyte, and
is
the molar mass particle / molar mass analyte, and ![]() is
the peak intensity of RM sample (CPS).
is
the peak intensity of RM sample (CPS).
When [Reference Element Response Factor] is empty, the Response Factor is applied to [Reference Element Response Factor] while processing the batch. If the target element of sample particles is different from that of RM, you need to input the reference element response factor manually. In this case, measure the response factor of RM element under the Tune tab prior to running batches. Input the acquired response factor of RM to the 'Reference Element Response Factor' column in Data Analysis manually once data acquisition starts.
Reference Element Ionic Standard Concentration
“IonicStd (RM)” is the sample type of the standard sample used for calibrating the response factor of the reference element. If you specify IonicStd (RM) as the sample type, you can update the [Reference Element Response Factor].
If [Reference Element Response Factor] is blank, it is updated using the same value as the response factor of the target element.
[Reference Element Response Factor] ![]() is calculated as,
is calculated as,
![]()
Where, ![]() means
the average of the signals in the IonicStd (RM) sample,
means
the average of the signals in the IonicStd (RM) sample, ![]() means the average of the signals in the IonicBlk
sample, and
means the average of the signals in the IonicBlk
sample, and ![]() means the concentration
of the IonicStd (RM) sample.
means the concentration
of the IonicStd (RM) sample.
For MassHunter 4.4 or earlier, the Response Factor is calculated from the RMS (baseline) of the IonicStd (RM) and the IonicBlk, but for MassHunter 4.5 or later, it is calculated from the average of the signals.
The Ionic Concentration of the IonicStd (RM)/IonicBlk for older versions results in a different value due to re-processing in the latest version.
[Reference Element Response Factor] and [Reference Element Ionic Standard Concentration] are available regardless of the Nebulization Efficiency calculation mode. If the target element and the reference element are the same, enter the same value as the response factor for the target element and the Ionic Standard Concentration respectively.
Reference Element Mass Fraction
This item is displayed only when you select [Calculated from RM Size] in [Nebulization Efficiency].
This is used to calculate the Nebulization Efficiency based on the size.
Mean Reference Particle Diameter
Average diameter of standard particles is suspension.
Reference Element Density
Material density of reference material. This depends of the elemental composition. For example, Au = 19.30 g/ml, Ag = 10.49 g/ml, SiO2 =2.634 g/ml, TiO2 = 4.23 g/ml, ZnO = 5.606 g/ml.
Mass Concentration of Reference Material
Mass concentration of standard particles in suspension.
Unknown Sample
Target Element Mass
Displays the mass number for the target elements in Unknown Sample.
Analyte Mass Fraction
This is the ratio between molar mass of the particle material and molar mass of the analyte being measured.
Particle Density
Particle density of unknown sample.
To Get Here
- Open the single particle analysis batch result in the [ICP-MSICP-QQQ Data Analysis] window.
- Select [Panes] - [Single Particle Method Editor] from the [Show] group on the [View] tab in the [ICP-MSICP-QQQ Data Analysis] window.