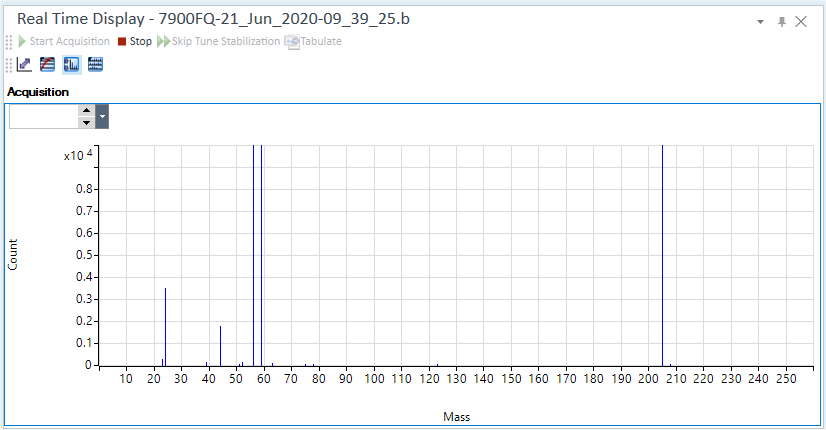
Real Time Display Pane
The [Real Time Display] pane displays the spectra of the sample that is being run in the queue, the timechart, and the spectra obtained in the full spectra acquisition.
This section describes the functions in the Real Time Display pane.
Title Bar
The title bar buttons and the context menu have the same functions as the Title Bar of the Instrument Status Pane.
Toolbar
Drag  to move the toolbar.
The buttons and functions on the left change according to the status of the queue.
 Click
this button while no acquisitions are being performed to start the
signal monitor.
Click
this button while no acquisitions are being performed to start the
signal monitor.-
 If you click this button while a pre-run
program, such as a sample replacement or stabilization wait, is running,
the pre-run program stops and the acquisition starts.
If you click this button while a pre-run
program, such as a sample replacement or stabilization wait, is running,
the pre-run program stops and the acquisition starts. -
 Click this button during an acquisition
to restart the acquisition for the current sample.
Click this button during an acquisition
to restart the acquisition for the current sample. - When on the Queue
Pane is ON, click this button to start the acquisition.
 Click this button to cancel the current acquisition.
You are asked if you wish to run a rinse program. If you click "Yes",
the probe is rinsed and the queue is stopped. If you click "No",
the queue is stopped but the probe is not rinsed.
Click this button to cancel the current acquisition.
You are asked if you wish to run a rinse program. If you click "Yes",
the probe is rinsed and the queue is stopped. If you click "No",
the queue is stopped but the probe is not rinsed.
 Ignores the tune stabilization time and the post-run
program, such as a probe rinse. The process goes to the next step. The
post-run program is ignored for each step.
Ignores the tune stabilization time and the post-run
program, such as a probe rinse. The process goes to the next step. The
post-run program is ignored for each step.
![]() Automatically adjusts the
scale for the X-axis and the Y-axis.
Automatically adjusts the
scale for the X-axis and the Y-axis.
![]() Changes the display between
log scale and linear scale.
Changes the display between
log scale and linear scale.
![]() Changes the display between Count view
and CPS view in Spectrum mode.
Changes the display between Count view
and CPS view in Spectrum mode.
![]() Changes the horizontal scale (1-row
or 3-row) in Spectrum mode.
Changes the horizontal scale (1-row
or 3-row) in Spectrum mode.
 Displays the acquisition values.
 Sends the current timechart data to the online data
analysis when the acquisition mode is TRA mode. While acquiring chromatogram
data, peak results up to the specified timing can be displayed in the
[ICP-MSICP-QQQ
Data Analysis] window.
Sends the current timechart data to the online data
analysis when the acquisition mode is TRA mode. While acquiring chromatogram
data, peak results up to the specified timing can be displayed in the
[ICP-MSICP-QQQ
Data Analysis] window.
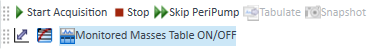
 Displays or
hides the table below the pane.
Displays or
hides the table below the pane.
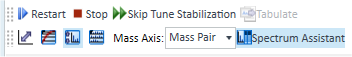
 Select a mode for Mass Axis.
[Mass Pair]: Displays the masses of Q1 and Q2 on the Spectrum Assistant table.
[Q1]: Displays the masses of Q1 on the Spectrum Assistant table.
[Q2]: Displays the masses of Q2 on the Spectrum Assistant table.
 Displays or hides the Spectrum Assistant table.
Context Menu
This section describes the commands that are available in the context menu, which is displayed when you right-click in the pane. The commands that are not listed below have the same function as their counterparts on the toolbars.
[Set Monitor Window] (TRA only)
The [Set Monitor Window] dialog box is displayed.
When the acquisition mode is set to TRA, set the Display Window and the Average Window.
- Set the horizontal axis of the Real Time Graph in the Display window.
- Set the time used to calculate the moving average of the signal in the Average window. This setting is used to display the signal of the laser ablation.
[Change Monitored Masses]
Displays the [Select Monitored Masses] dialog box where you can change the masses to be monitored.
[Export Graphics]
Opens the [Export Graphics] dialog box where you can export graphics data from a graphics pane in the specified file format.
[Print]
Opens the [Print] dialog box where you can print the contents of the selected pane.
Real Time Graph
The functions vary depending on the analysis mode.
Spectrum Mode
Displays a graph with the mass (2 to 260) on the Y-axis and the count or CPS on the X-axis.
When the Scan Type is [MS/MS], the range of monitored masses is 2 to 260 for Q1 and 2 to 275 for Q2.
The display is updated every 3 sec.
Adjusting the Scales, Shifting the Axes, and Expanding a Selected Area can be done in the same way as the Spectrum pane for data analysis.
TRA Mode
Displays a graph with the count on the Y-axis and the time on the X-axis.
In TRA mode, a value table is displayed below the graph.
The scale of the Y-axis can be changed by entering the range in the [Range] column.
During pre-run monitor, 'Pre Run' is displayed at the top, most left side of chart area.
During acquisition, 'Acquisition' is displayed at the top, most left side of chart area.
During post-run monitor, 'Post Run' is displayed at the top, most left side of chart area.
Spectrum Assistant table
[Display] column
Only the peaks of the selected masses are displayed in the Spectrum pane.
[Q1] column
Displays the masses of Q1.
[Q2] column
Displays the masses of Q2.
To Get Here
- Click [Acquisition Queue] from the [Queue] group in the Task Navigator.