Analyzing Single Nanoparticles using the Optional Single Nanoparticle Application Module
When the optional single nanoparticle application module is activated, configuring a batch including both data acquisition and data analysis parameters is managed via the Method Wizard.
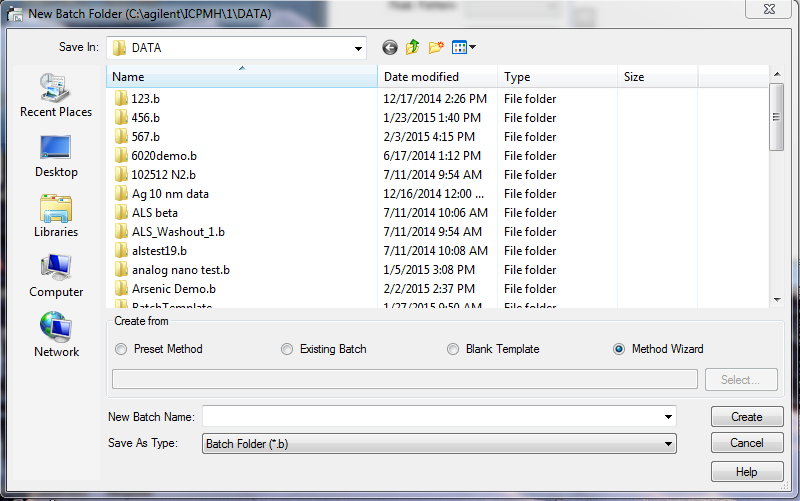
- Click [New] from the [Batch] group on the [Home] tab.
- Click the [Method Wizard] radio button in the “Create from” group at the bottom of the [New Batch Folder] dialog box.
- Provide a name for the new batch, and then click [Create].
The first screen displayed is the Method Wizard Introduction screen which provides some brief instructions on the use of the Method Wizard and an overview of your Hardware Configuration.
- Click [Next>].
The Analysis Mode screen is displayed. If the Nanoparticle Applications Module is activated, the Nanoparticle options are displayed as shown below. Select the Nanoparticle analysis mode you want to use. The first three selections, “Single Element / Isotope”, “Rapid Multi-Element Nanoparticle Analysis” and “2 Elements / Isotopes” use fast TRA mode and special data analysis for single particle analysis. The last selection, “FFF ICP-MS”, sets up the system for conventional TRA acquisition similar to that used for LC-ICP-MS.
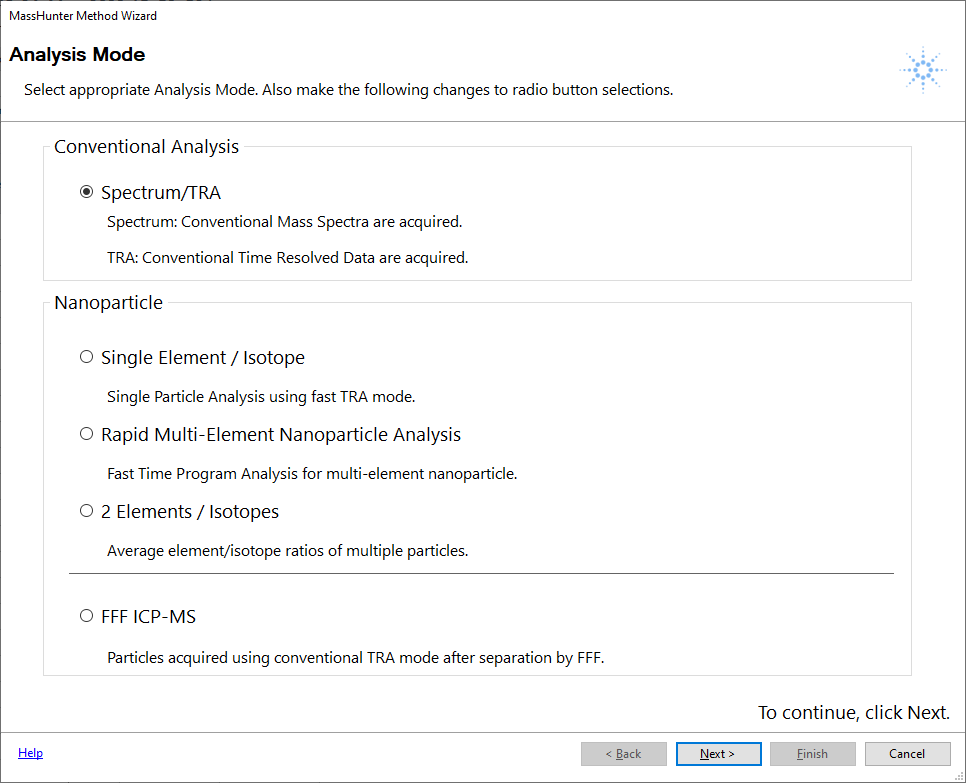
In this example, we will use Single Particle Analysis to demonstrate the process.
- Click [Next>].
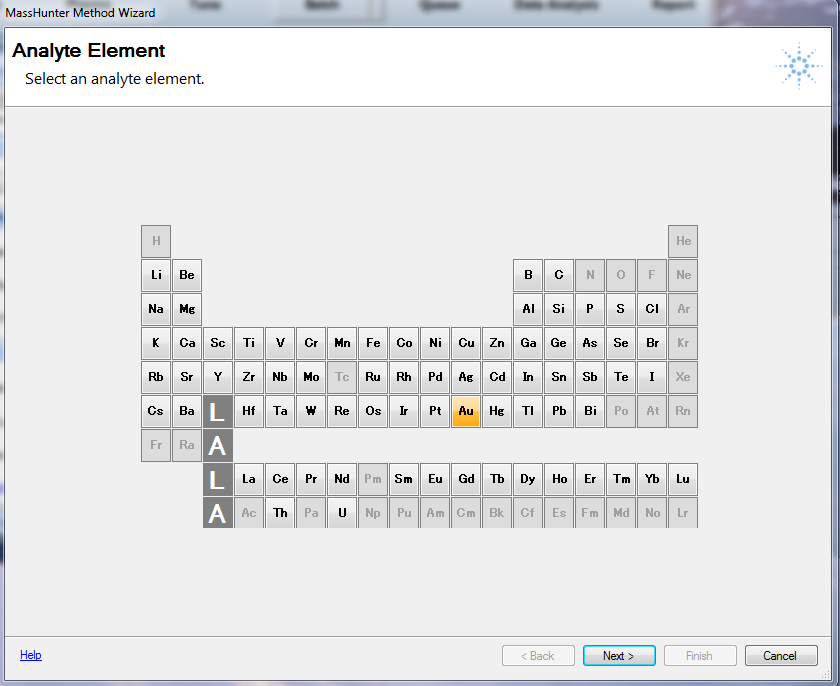
There is a short delay while the nanoparticle batch is created, after which you are prompted to select an analyte element from the Periodic Table by clicking on the element. The selected element is highlighted as shown below.
- Click [Next>].
The Single Particle Analysis Configuration screen is displayed. This screen contains all the information necessary to calculate the typically required information about a sample containing single nanoparticles.
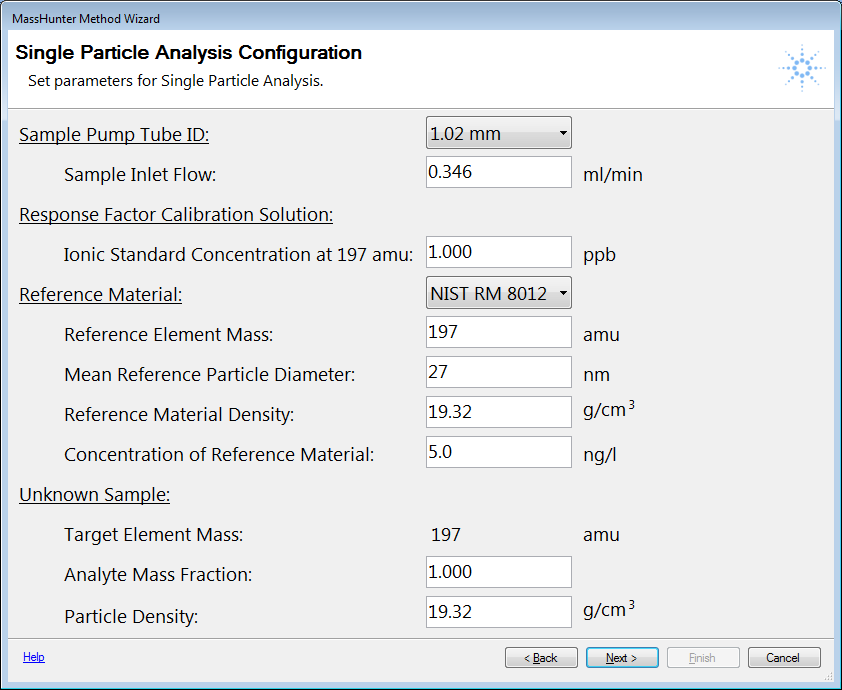
- Sample Pump Tube ID: This value is used to calculate the sample flow which is required for the nebulization efficiency calculation. Select the correct nebulizer pump tube ID from the pull-down list. The flow is calculated assuming that the nebulizer pump is set to the normal default value of 0.1 rps. Alternatively, if you have determined the actual flow by another method, you can type the actual flow into the Sample Inlet Flow field.
- Response Factor Calibration Solution: The Response Factor Calibration Solution is a calibration standard containing a dissolved ionic standard (not a nanoparticle solution). As in any quantitative ICP-MS analysis, a response factor calibration is required for the analyte elements of interest. This is the element you selected on the Periodic Table. In this case, we selected Au (mass 197). Note that the correct mass was automatically entered. This should be matrix matched to your samples and reference materials since no internal standards are used to compensate for matrix differences. Type the concentration of your RF calibration standard into the field.
- Reference Material: This is the nanoparticle reference material used to calibrate the nanoparticle algorithm. There are four choices available from the pull-down list box; [Custom], [NIST RM 8012 (30 nm Au)], [NIST RM 8013 (60nm Au)], and [none]. If you do not have one of the listed NIST reference materials, you can select “Custom” and enter the correct values for the material you are using. It is not necessary for the reference material and analyte elements to be the same.
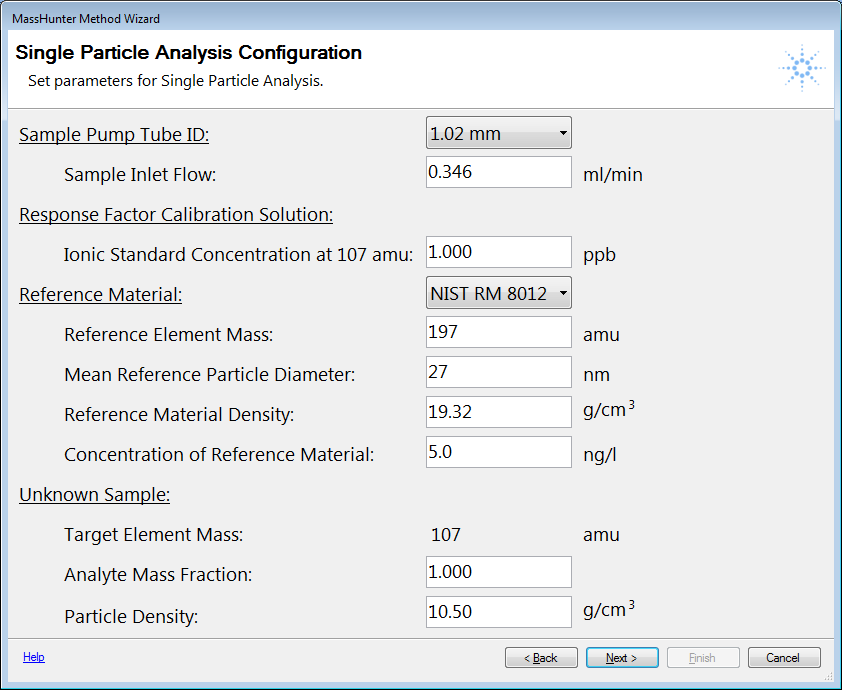
In the screen capture below, NIST 8012 is selected as the Reference Material, and silver is selected as the Unknown sample. Note that for silver, 1 isotope was automatically selected (107). This can be changed in the final Element Selection Pane to a different isotope.
- Click [Next>].
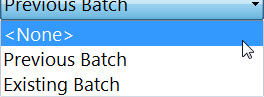
The Import Reference and Calibration Sample screen is displayed.
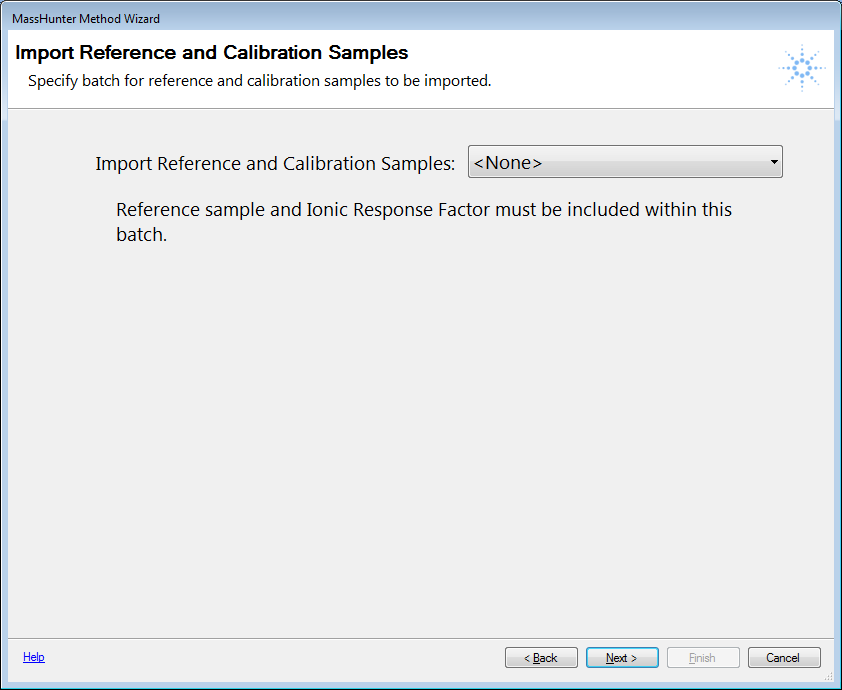
This function allows you to use a Reference Material and Ionic Calibration Blank and Standard from an earlier batch. There are three choices in the pull-down list box.
- “None” means that the Calibration and Reference Samples must be acquired in the current batch along with the samples.
- “Previous Batch” imports the Reference and Calibration information from the batch immediately preceding the current batch in the Queue. This is useful when you are analyzing multiple types of nanoparticles (different elements) in a series of batches, but want to reference them to a single Reference Material.
- “Existing Batch” prompts you to select an existing batch (previously acquired) to import the Reference and Calibration values.

- Click [Next>].
The next screen instructs you to click [Finish] to complete creating the new nanoparticle batch.
- Click [Finish].
- Click [Element Selection] from the [Acquisition] group in the Task Navigator.
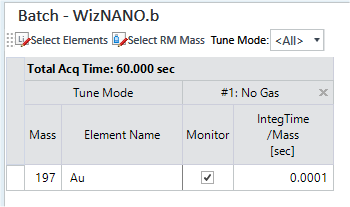
The Element Selection Pane is displayed.
At this point, you can edit the batch if necessary (for example to change an analyte isotope), integration time, acquisition time etc. You are notified that the batch is ready for use, or can be saved as a template for future use. The default integration time is automatically set to the time available for your instrument (3ms for 7700, 7800 and 8800, 0.1ms for 7900 and 8900). However, the default integration time is 0.1 ms when the Fast TRA option is activated on Agilent 7800 ICP-MS. The Acq Time (total acquisition time) is set to 60 seconds. Both can be changed as necessary.
- However, note that integration times between 0.2ms and 3ms are not analytically useful for single nanoparticle analysis.
- If the batch is created for "Rapid Multi-Element Nanoparticle Analysis", the maximum acquisition time per analyte can be set 180 sec.
- Click [Sample List] from the [Sequence] group in the Task
Navigator.
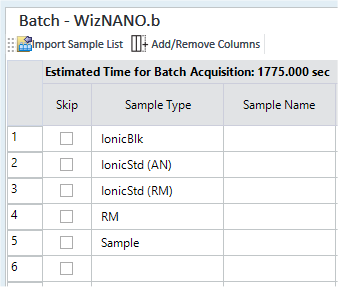
The Sample List Pane (Sequence) is displayed.
The required calibration and reference standards have been added to the sample list. Edit these as necessary, and fill in the list of samples.
- Click [Sample Introduction] from the [Acquisition] group in the
Task Navigator.
The Sample Introduction Pane is displayed.
Verify that the PeriPump/ISIS parameters, such as uptake and rinse values, are set correctly.
- Click [Tune Modes] from the [Acquisition] group in the Task
Navigator.
The Tune Modes Pane is displayed.
Only one tune mode can be used for each batch. In general, optimum performance requires the highest possible signal and lowest possible background for the analytes.
- Click [Single Particle] from the [Acquisition] group in the Task Navigator.
The Single Particle Pane is displayed.
You can review the default single particle data analysis settings from here. However, some of these values are updated automatically within Data Analysis, based on acquired data, once the Calibration and Reference Samples have been acquired. These values can then be adjusted manually if necessary from within Data Analysis.
- Save the batch and add to Queue for analysis or Save as a Template
Batch for future use.
Add to Queue:
Click [Add to Queue] from the [Batch] group on the [Home] tab. You are prompted to save the batch and add it to the Queue for immediate execution.
After acquisition:
- Click [Save As Batch Template] from the [File] tab.
- Provide a suitable name for the batch template.
This function is useful if the nanoparticle reference material (RM) is composed of a different element than the nanoparticles in the sample (for example gold reference material and TiO2 sample particles), which may be useful if no suitable reference material is available for the analyte particles. This allows the nebulization efficiency to be calculated and imported without the requirement for acquisition of more than 1 isotope in a batch.
Running the Batch and analyzing the results.
Add the batch to the Queue where it is automatically run and Data Analysis opens and is updated after each analysis. The default layout for Data Analysis is displayed below. The upper table is consistent with other MassHunter batch results tables. The default columns displayed are shown below. The choices for the Sample group are the standard choices, which can be changed by right clicking anywhere in the upper half of the screen (where the table exists). However, several new, dedicated Analyte parameters have been added which are specific to single nanoparticle analysis.
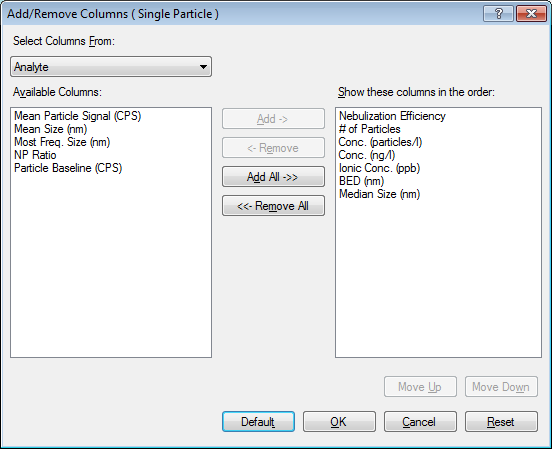
- Nebulization Efficiency – is calculated automatically (or entered manually) as the ratio of detected particles to the reference number of particles.
- # of Particles - is the total number of particles (peaks) detected over the acquisition time.
- Particle Conc. (particles/l) - is the number of particles per liter of sample.
- Mass Conc. (ng/l) - is the mass concentration of particles in the sample.
- Ionic Conc. (ppb) - is the concentration of the dissolved (ionic) component of the sample for the same element as the particle determination.
- BED (nm) (Background Equivalent Diameter) - is the calculated spherical diameter of a virtual particle based on the background signal. The background signal may be composed of instrument background, spectral interferences and dissolved ionic analyte. This value is similar to BEC. This value provides a rough estimate of the lower limit of size detectability.
- Mean Particle Signal Column
This indicates the average calculated from signals over [Particle Detection Threshold] and within a specified [Particle Detection Range].
- Median Size (nm) - displays the median particle size (nm).
- Mean Size (nm) Column
Displays the mean particle size (nm).
- Most Freq. Size (nm) Column
Displays the particle diameter (mm) of the particle with the highest frequency.
- NP Ratio Column
Displays the intensity ratio of two Isotopes when analyzing two isotopes in a single particle.
- Particle Baseline column
Displays the Particle Baseline (CPS).
- FullQuant Signal (CPS) column
Displays the CPS of the respective analyte element(s) using FullQuant analysis based on the mean signal of the TRA data over the specified range.
- FullQuant Conc. (ppb) column
Displays the concentration of the respective analyte element(s) using FullQuant analysis of the mean FullQuant signal (CPS) divided by the element response factor (CPS/ppb).
- Mean Mass (ag) column
Displays the mean mass of analyte element per particle (atto gram = 10-18 gram).
- Median Mass (ag) column
Displays the median mass of analyte element per particle (atto gram = 10-18 gram).
- Most Freq. Mass (ag) column
Displays mass of analyte element per particle with the highest frequency (atto gram = 10-18 gram).
- Particle Detection Threshold column
The limit value (CPS) that separates particles from noise and ions.
- FullQuant Meas. Conc. (ppb) column
Displays the concentration of the measured data. Displays the concentration for each element to which the dilution factor is not applied.
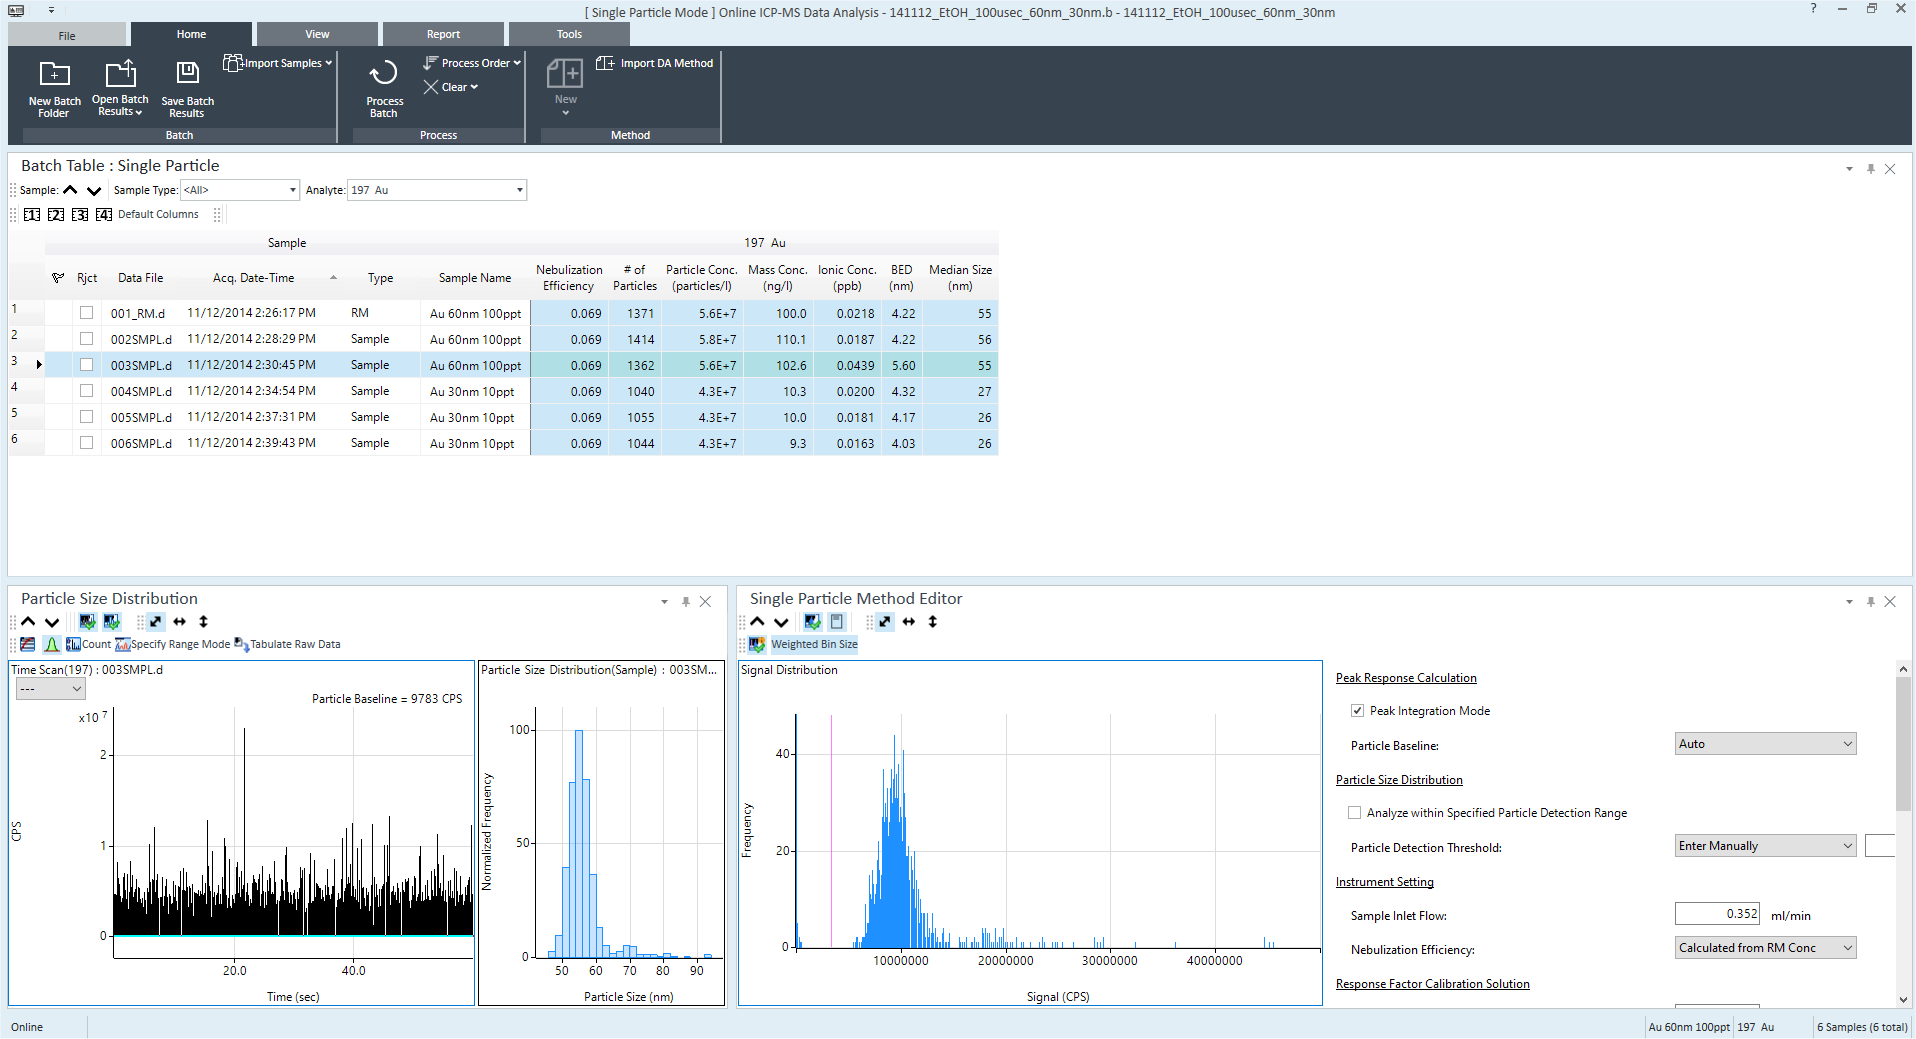
The display above shows the raw TRA signal versus time on the far lower left, the particle size distribution in the lower center, and the frequency of distribution of various particle responses (related to size) on the right. The table on the far right displays the values used in the calculation of results for the selected sample in the batch table.
Manual optimization of results
Several parameters, while calculated automatically, can be manually edited to optimize the calculation of results.
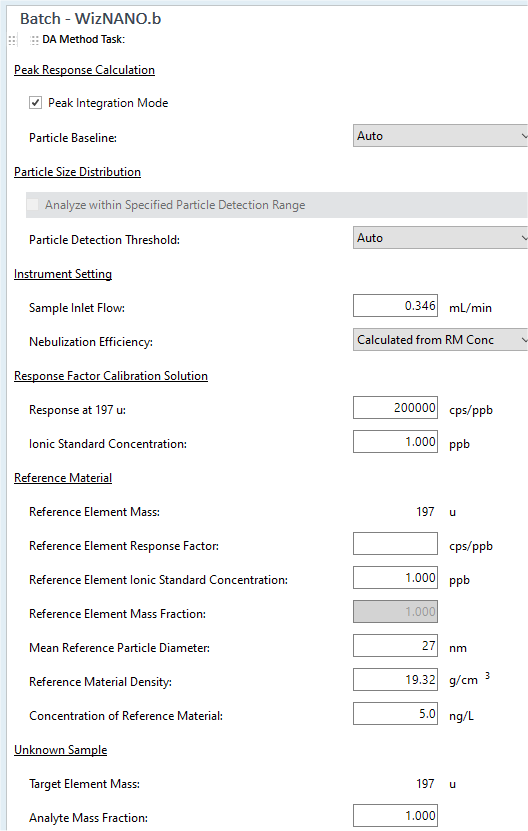
Peak Integration Mode – Sums the signal for several adjacent integration times to integrate the total signal for a particle event (peak) when the integration time is shorter than the particle event duration. This should be enabled for integration times of 0.1 or 0.2 ms, but not for longer integration times.
Particle Baseline – Select [Auto]
or [Enter Manually] as the particle baseline. [Auto] calculates the baseline
automatically. [Enter Manually] allows you to specify the baseline for
each sample by entering a baseline value (CPS) into the text box. By clicking
the ![]() icon, you can display the baseline on the time scan panel. However, you
cannot use it for the calibration category sample type (IonicBlk, IonicStd
(AN) and IonicStd (RM)).
icon, you can display the baseline on the time scan panel. However, you
cannot use it for the calibration category sample type (IonicBlk, IonicStd
(AN) and IonicStd (RM)).
Analyze within Specified Particle Detection Range – When enabled, this function allows the user to select the lower and upper intensity (particle size) thresholds before processing. In this way, a sample containing particles of more than one size range (for example 30nm and 60nm particles) can be analyzed by sequentially changing the detection range and re-processing the data.
Sample Inlet Flow – Automatically calculated, but can be overwritten by the user with a measured flow if necessary.
Nebulization Efficiency – Calculated from the RM sample, but can be manually entered from an empirically derived measurement if necessary.
Response Factor Calibration Solution – The response factor is automatically updated when you analyze the IonicBlk and IonicStd (AN) solutions. Alternatively, the response factor can be entered manually from a value determined in functions such as Tune. The Ionic Standard Concentration cell is necessary to convert the response in cps to a response factor in cps/ppb.
Reference Material – The values in this section are provided at the time the method is set up using the Method Wizard, either from pre-set values for 2 NIST reference materials, or entered manually for other reference materials. They can also be edited from here.
Unknown Sample – The two values required here are the Particle Density in g/cm3 and Analyte Mass Fraction. The Analyte Mass Fraction = Molar Mass of Particle/Molar Mass of Analyte. For particles composed of pure elements such as gold, the value is 1. For particles composed of compounds such as TiO2, the value is a number larger than 1.
Tips and Tricks for special situations
- Importing Reference Values
- The automatically selected isotope for the element you selected from the periodic table in the Method Wizard may not be the isotope you want to measure.After the Method Wizard has completed creating the batch, open the Element Selection Pane for confirmation and editing if necessary. Click the [Select Element] in the toolbar to open the periodic table and change the isotope to an alternate one.
a. From Data Analysis, the nebulization efficiency can be entered manually.
![]()
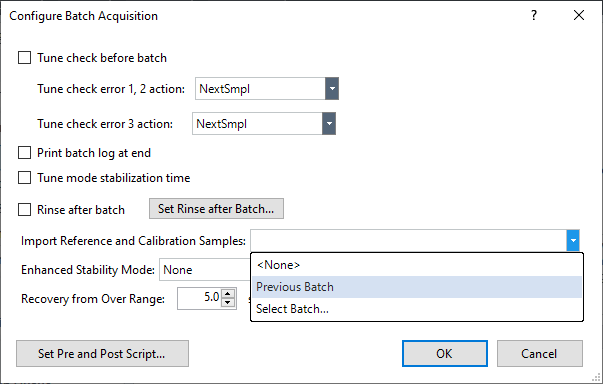
b. When creating the batch for the samples using the Method Wizard, you can instruct MassHunter to automatically import reference values from either the previous batch (the batch immediately preceding the sample batch in the Queue) or from a user-selected existing batch. Refer to the Import Reference and Calibration Sample screen for details.
c. After creating the acquisition batch, edit it in the [Configure Batch Acquisition] dialog box which is displayed by selecting [Advanced Configuration] in the Setup pane.