Tune Modes Pane
This section describes the functions of the commands that are available in the Tune Modes pane.
Lets you configure the tune settings and start a tuning.
The functions and display items depend on the mode that is selected in the [Configure Tune Way] dialog box, which appears when you click [Configure Tune Way].
- Toolbar
- Context Menu
- [Scan Type] Table
- [Plasma] Table
- [Lenses] Table
- [Q1] table
- [Q1 Ion Guide] table
- [Q2 Ion Guide] table
- [Cell] Table
- [Q-Pole] Table
- [Q2] table
- [Torch Axis] Table
- [EM] Table
- [Wait Time Offset] table
- Real Time Display Graph
- Real Time Display Table
- To Get Here
Toolbar
Task Setting Toolbar


 Displayed
when you open a batch in Single Particle Analysis. The [Response
Factor Calibration] dialog box is displayed. Measure the Response
Factor that is required for Single Particle Analysis.
Displayed
when you open a batch in Single Particle Analysis. The [Response
Factor Calibration] dialog box is displayed. Measure the Response
Factor that is required for Single Particle Analysis.
 Sends the tuning parameters to the ICP-MSICP-QQQ.
 Starts a AutoTune.
The behavior depends on the selected tune method.
When [Auto Tune] is selected
The [Start Auto Tune] dialog box is displayed. After you select whether to do all tune modes or the specified tune modes, the autotune starts.
When [Custom Tune] is selected
The [Start Semi Auto Tune] dialog box is displayed. After you select whether to do all tune modes or the specified tune modes, the semi autotune starts.
 Starts the
signal monitor for the currently selected tuning mode.
Starts the
signal monitor for the currently selected tuning mode.
When a signal monitor starts, the icon changes to  . Click
this icon if you want to stop the signal monitor.
. Click
this icon if you want to stop the signal monitor.
 This button is displayed when using Discrete Sampling (AVS) or Autodilution
(ADS 2). If you are using AVS, the [AVS
Timing Monitor Configuration] dialog box is displayed. If you are
using ADS 2, the [ADS
2 Timing Monitor Configuration] dialog box is displayed.
This button is displayed when using Discrete Sampling (AVS) or Autodilution
(ADS 2). If you are using AVS, the [AVS
Timing Monitor Configuration] dialog box is displayed. If you are
using ADS 2, the [ADS
2 Timing Monitor Configuration] dialog box is displayed.
Once configured, you can start the Timing Monitor, which you can use to optimize the parameters in the Sample Introduction pane.
 Stops the running Timing Monitor.
 Displays the
[Configure
Tune Way] dialog box.
Displays the
[Configure
Tune Way] dialog box.
 Set the masses.
The [Set Acq Parameters for Manual Sensitivity Tune] dialog box appears.
 When
the [Resolution/Axis] Tab is selected,
this button is displayed.
When
the [Resolution/Axis] Tab is selected,
this button is displayed.
The [Set Acq Parameters for Resolution/Axis] dialog box appears, which lets you set masses and the integration time.
Display Toolbar
![]()
 Automatically adjusts the scale for the Y-axis on
the Real Time Display Graph.
Automatically adjusts the scale for the Y-axis on
the Real Time Display Graph.
 Changes the display between log scale and linear
scale on the Real Time Display Graph.
Changes the display between log scale and linear
scale on the Real Time Display Graph.
Tune Mode Tab

Click here when you want to change the tune mode.
The tab button has the following functions:
- You can edit the name by double-clicking the tab of the tune mode.
- When you click on the [New Sheet] tab, a tune mode tab with the same content as the tune mode furthest to the right is added.
- Click the [X] on the tab to display a confirmation message asking if you want to delete the tune. Click [OK] to delete the tune mode.
- By dragging and dropping the tab button, you can change the order of the tune mode.
- Right-click in the tune mode tab to display the following context
menus:
[Rename Tune Mode]
Lets you change the name that is displayed in the tune mode tab.
[Configure Tune Modes]
Opens the [Configure Tune Modes] dialog box, which lets you copy or delete the tuning mode.
[Copy Tune Parameters]
Opens the [Copy Tune Parameters] dialog box, that allows you to copy the tune parameters.
You can set up to 16 tune modes.
For Rapid Multi-Element Nanoparticle Analysis, you can set 17 or more tune modes. To use this feature, turn on [sNP Extended Functions] from the [Add-Ins] group on the [Tools] tab, and turn on [Extended Acquisition] from the [sNP Extended Functions] group on the [sNP Extension] tab displayed.
Context Menu
This section describes the commands that are available in the context menu, which is displayed when you right-click on the tab. The commands that are not listed below have the same function as their counterparts on the toolbars.
[Tune]
[Configure Tune Way]
Opens the [Configure Tune Way] dialog box, which lets you select a tuning way.
[Set Tune Check Criteria]
Opens the [Set Tune Check Criteria] dialog box, which lets you set the check criteria for tuning.
[Rename Tune Mode]
Lets you change the name that is displayed in the tab of the tuning mode. You can also change the name by double-clicking the tab of the tuning mode.
[Configure Tune Modes]
Opens the [Configure Tune Modes] dialog box, which lets you copy or delete the tuning mode.
[Copy Tune Parameters]
Opens the [Copy Tune Parameters] dialog box, that allows you to copy the tune parameters.
[Parameters for Auto Tune]
The [Set Acq Parameters for Auto Tune] dialog box appears.
Set the acquisition parameters for autotune or lens autotune in a custom tune.
[Set Acq Parameters for Sensitivity]
The [Set Acq Parameters for Manual Sensitivity Tune] dialog box appears.
Set the sensitivity measurement parameters for a custom tune or signal monitor for each tuning mode.
[Set Acq Parameters for Resolution/Axis]
When the [Resolution/Axis] Tab is selected, a menu appears.
The [Set Acq Parameters for Resolution/Axis] dialog box appears, which lets you set masses and the integration time.
[Set Batch Wide Parameters]
Lets you set common tune parameters across different tune modes in a batch for custom tuning. The [Set Batch Wide Parameters] dialog box is displayed.
[Show/Hide Tune Parameters]
Lets you select which tune parameters to display for a custom tune or signal monitor for each tune mode. The [Show/Hide Tune Parameters] dialog box is displayed.
[Report]
[Generate Tune Report]
Opens the [Generate Tune Report] dialog box, which lets you generate a tune report.
[Display Previous Tune Report]
Displays the previous tune report.
[Print Current Signal]
Displays sheet that contains the signals, count table, tuning parameters, tuning mode name and other information from the Real Time DisplayTable. The report can be printed from Report Designer.
The Report Template for the Current Signal Report is stored in the following path:
C:\Program Files \Agilent\ICPMH\Report\CRE\en\CurrentSignal.tune.acrt
[Display]
[Auto Scale-Y]
Automatically adjusts the scale for the Y-axis on the Real Time Display Graph.
[AVS]
This menu is enabled when you use AVS.
[Manual Operation]
Opens the [Manual Operation] dialog box for manual operations of AVS.
[Run PreRun Program]
Starts the AVS PreRun program.
[Run StartRun Program]
Starts the AVS StartRun program.
[Run PostRun Program]
Starts the AVS PostRun program.
[Stop Program]
Stops the AVS program.
[ADS 2]
Works when the Autodilution is used in ADS 2.
[Run ADS 2 Dilution Program]
[ADS 2 Dilution Program Configuration] dialog box appears. Set the dilution factor and data acquisition time and click [Start] to start the dilution program.
[Stop ADS 2 Dilution Program]
Stop the dilution program.
[Repeat Resolution/Axis]
When the [Resolution/Axis] Tab is selected, a menu is displayed.
When this menu item is selected, when you click  on the toolbar, the resolution/axis measuring starts and replicated analyses
are performed until you click .
on the toolbar, the resolution/axis measuring starts and replicated analyses
are performed until you click .
[Check Random Noise]
[Check Off Mass Background]
Starts the acquisition to check the background.
The acquisition continues until you click this menu item. The real time data is displayed in Real Time Display Graph on the right side.
[Ramp Cell Gas]
This item can be used when [Custom Tune] or [Signal Monitor] is selected on the [Configure Tune Way] dialog box. The cell gas flow is ramped and the BEC (background Equivalent concentration) is calculated at each gas flow to find the optimum gas flow rate.
The [Set Ramp Cell Gas] dialog box is displayed. After you enter the maximum and minimum values of the sweeping gas flow rate and other parameters the data acquisition starts.
[Acquire Full Spectrum]
Acquires the full spectrum within the range from 2 to 260 (except for prohibited masses) for fault diagnosis. The acquisition is done under the conditions of 1 point per mass, integration time 0.1 sec/point, and repeats 3 times. The acquired data is displayed in Real Time Display Graph and saved in the current batch.
[Precursor/Product Ion Scan]
This item is displayed in MS/MS mode. The [Precursor/Product Ion Scan] dialog box is displayed and allows you to perform the Precursor/Product Ion Scan.
[Acquire Sensitivity -Oxide Profile]
Acquires the oxide ratio profile for fault diagnosis. Although the acquired data is not displayed, the data is saved in the batch folder and can be used by Field Service Engineers for instrument diagnosis.
[Auto RF Matching]
Starts the automatic adjustment of RF matching.
Perform RF matching when the cool plasma mode is used, organic solvents are analyzed, or the torch is replaced. It helps to stabilize the plasma ignition and enhance the sensitivity.
[Clear Plot]
Clears the signals that is currently displayed on the tuning screen. Use this function to recalculate the average count or RSD.
[Export Graphics]
Opens the [Export Graphics] dialog box, which lets you export graphics data from a graphics pane in the specified file format.
[Print]
Opens the [Print] dialog box, which lets you print the contents of the selected pane.
[Scan Type] Table
Select a scan type from the [Scan Type] list.
[Single Quad]: Does a Single Quad scan.
[MS/MS]: Does an MS/MS scan.
The scan type that is selected here is applied only for sensitivity tuning. In sample acquisition, the scan type specified on the Element Selection Pane is used.
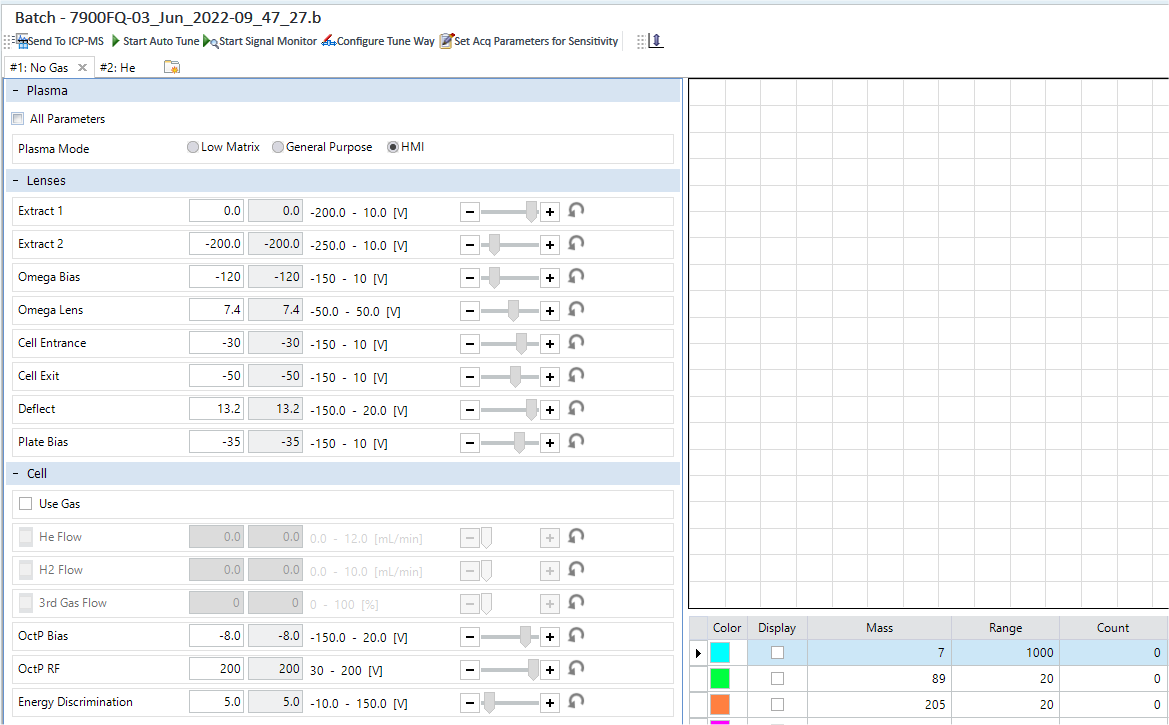
[Plasma] Table
The following items can be operated when [Custom Tune] or [Signal Monitor] is selected on the [Configure Tune Way] dialog box.
[All Parameters]
Displays all plasma parameters.
You can set the values by entering a value in the text box or by operating
the scroll bar. Click  to restore
the previous value. This item cannot be changed during a custom tuning
or when the signal monitor is active.
to restore
the previous value. This item cannot be changed during a custom tuning
or when the signal monitor is active.
[Plasma Mode]
Select a plasma mode. This item cannot be changed during a custom tuning or when the signal monitor is active.
Plasma Mode can only be modified when the combination of nebulizer and lens are Valid. The following table shows the results of executing [Validation] from the [Batch] group on the [Home] tab.
Nebulizer |
x-lens |
s-lens |
m-lens |
|---|---|---|---|
MicroMist |
Valid |
Valid |
Error |
Mira Mist |
Valid |
Error |
Error |
MicroFlow (200) |
Error |
Valid |
Valid |
MicroFlow (20-50) |
Error |
Warning |
Error |
Other |
Warning |
Warning |
Warning |
When x-lens is used, [General] is selected in general. If the total matrix concentration is 0.2% or higher, select [HMI]. When matrix effects are small as in the case of pure water and you perform an acquisition focusing on the sensitivity, select [Low Matrix].
When [Aerosol Dilution Mode for HMI] is selected on the [Options] category in the [Settings] dialog box, if [HMI] is selected, the dilution setting can be selected from three levels: HMI-4, HMI-8, and HMI-25.
When [Aerosol Dilution Mode for HMI] is selected on the [Options] category in the [Settings] dialog box, if [HMI] is selected, the dilution setting can be selected from five levels: HMI-4, HMI-8, HMI-25, HMI-50, and HMI-100.
When s-Lens is used, [Hot] and [Cool] are displayed.
When m-Lens is used, [Hot] is selected.
The following tables show the values of the parameters that are set when each plasma mode is selected. To check each value, select Custom Tune or Signal Monitor as the tune method, and then turn on [All Parameters].
|
x-lens |
s-lens |
|||
|---|---|---|---|---|---|
Plasma mode |
Low Matrix |
General |
HMI-8 |
Hot |
Cool |
RF Power (W) |
1550 |
1550 |
1600 |
1500 |
600 |
Smpl Depth |
8.0 |
10.0 |
10.0 |
8.0 |
18.0 |
Nebulizer
Gas |
1.05 |
1.05 |
0.35 |
0.7 |
0.7 |
Nebulizer Pump |
0.1 |
0.1 |
0.1 |
0.1 |
0.1 |
S/C Temp (°C) |
2 |
2 |
2 |
2 |
2 |
Makeup Gas |
0.0 |
0.0 |
0.0 |
0.5 |
0.8 |
Dilution Gas (L/min) |
- |
- |
0.6 |
- |
- |
|
x-lens |
s-lens |
|||
|---|---|---|---|---|---|
Plasma mode |
Low Matrix |
General |
HMI-8 |
Hot |
Cool |
RF Power (W) |
1550 |
1550 |
1600 |
1500 |
600 |
Smpl Depth |
8.0 |
10.0 |
10.0 |
8.0 |
18.0 |
Nebulizer
Gas |
1.05 |
1.05 |
0.35 |
0.7 |
0.7 |
Nebulizer Pump |
0.1 |
0.1 |
0.1 |
0.1 |
0.1 |
S/C Temp (°C) |
2 |
2 |
2 |
2 |
2 |
Makeup Gas |
0.0 |
0.0 |
0.0 |
0.5 |
0.75 |
Dilution Gas (L/min) |
- |
- |
0.6 |
- |
- |
|
x-lens |
s-lens |
m-lens |
|||
|---|---|---|---|---|---|---|
Plasma mode |
Low Matrix |
General |
HMI-8 |
Hot |
Cool |
Hot |
RF Power (W) |
1550 |
1550 |
1600 |
1500 |
600 |
1500 |
Smpl Depth |
8.0 |
10.0 |
10.0 |
8.0 |
18.0 |
8.0 |
Nebulizer
Gas |
1.05 |
1.05 |
0.35 |
0.7 |
0.7 |
0.7 |
Nebulizer Pump |
0.1 |
0.1 |
0.1 |
0.1 |
0.1 |
0.1 |
S/C Temp (°C) |
2 |
2 |
2 |
2 |
2 |
2 |
Makeup Gas |
0.0 |
0.0 |
0.0 |
0.5 |
0.75 |
0.5 |
Dilution Gas (L/min) |
- |
- |
0.6 |
- |
- |
- |
[RF Power]
Sets the RF power that is supplied to the load coil. A higher RF power increases the sensitivity and reduces oxide and doubly-charged ions. However, lighter masses may be less sensitive when the RF power is too high.
[RF Matching]
Sets reflected RF that is returned from the load coil. While the RF matching can be adjusted manually, the automatic RF matching is useful.
[Smpl Depth]
It sets the distance between the edge of the load coil and the tip of the sampling cone. A shorter sampling depth increases sensitivity, but the oxide level increases as well.
[Nebulizer Gas]
Controls the nebulization efficiency of a sample and the sample uptake rate for self-aspiration.
[Optional Gas]
When the optional gas line is added, it is possible to introduce a gas other than argon (such as the introduction of oxygen to measure organic solvent).
Indicates use of a gas other than argon (such as the introduction of oxygen to measure organic solvent).
[Nebulizer Pump]
Sets the pump speed of the pumps that are used to load samples or to drain the spray chamber. It affects sensitivity, stability of signal, and oxide and doubly-charged formation. Higher speed increases sensitivity, but too high speed, decreases sensitivity. Higher speed increases oxide and doubly-charged ions.
[S/C Temp]
Sets the temperature of the spray chamber. Lowering the spray chamber temperature causes the sample vapor temperature to lower and removes more water, thus, reducing the oxide levels. It should be set at 2ºC for aqueous sample to avoid ice formation. When aspirating organic solvents, run the chamber at -5ºC.
[Gas Switch]
If you select [Makeup Gas], the items of [Makeup Gas] are displayed at the bottom line. If you select [Dilution Gas], the items of [Dilution Gas] are displayed.
[Makeup Gas] or [Dilution Gas]
Adjusts the flow rate of the dilution gas or makeup gas that is used when you introduce the gas in the spray chamber to mix with the nebulizer gas (also called carrier gas). This parameter can be viewed or set offline.
[Plasma Gas]
Adjusts the flow rate of the Plasma Gas.
[Auxiliary Gas]
Adjusts the flow rate of the Auxiliary Gas.
[Lenses] Table
The following items can be set when [Custom Tune] or [Signal Monitor] is selected on the [Configure Tune Way] dialog box.
You can set the values by entering a value in the text box or with the
scroll bar. Click to restore
the previous value.
[Extract 1]
Extracts ions from the plasma to accelerate them toward the Omega lens. Adjust to get enough sensitivity for all masses.
This is the lens that needs the most frequent adjustment daily.
Usually, adjust it between 0 V and about a few V. An element of low mass gets maximum sensitivity at low voltage.
On the other hand, an element of high mass number gets maximum sensitivity at high voltage. Therefore, select the appropriate voltage. While a high sensitivity is attained at a voltage of about -100 V, the polyatomic ionic background tends to be larger in cell gas mode.
[Extract 2]
Focuses the ion beam from the extraction lens. An element of low mass gets maximum sensitivity at low voltage.
[Omega Bias]
Sets the potential of the Omega bias lens. The more negative voltage, the higher the sensitivity, but the background might increase.
[Omega Lens]
Separates the ions from photon and introduces the ions to the Cell. Adjusts to get good sensitivity for all masses.
[Q1 Entrance]
The lens for condensing ions on the Q1 prefilter.
While sufficient sensitivity is attained at about 0 V, if the polyatomic ionic background is large, adjust the voltage lower than 0V (-5V to -10V).
[Q1 Exit]
Adjusts the lens for condensing ions from the Q1 pole on the reactive cell to give sufficient sensitivity for all masses.
[Cell Focus]
Adjusts the lens on the most front side of the reactive cell and used for condensing ions on the octopole to give sufficient sensitivity for all masses.
[Cell Entrance]
Adjust to get enough sensitivity for all masses. It is necessary to set a lower voltage than the OctP bias.
[Cell Exit]
Adjust to get enough sensitivity for all masses. If the OctP bias voltage is changed, the cell exit value also needs to be simultaneously changed by the same degree.
[Deflect]
Deflects the ions that move from the octopole to the Q2-pole, thereby reduces the background.
[Plate Bias]
Re-focuses the ion beam.
[Q1] table
The following items are available when [Custom Tune] is selected as the tune method.
Note that the items marked with "*" in this section are related to the hardware settings and these items are usually not displayed. Those items are displayed when [Custom Tune] and [Override Hardware Settings] are selected or [Signal Monitor] and [Show Hardware Settings] are selected on the [Configure Tune Way] dialog box.
You can set the values by entering a value in the text box or with the scroll bar. Click
to
restore the previous value.
*[Q1 Mass Gain]
Adjusts the resolution (peak width) of Q1. Increasing the value narrows the peak width. The higher the mass, the greater the effect.
*[Q1 Mass Offset]
Adjusts the resolution (peak width) of Q1. Increasing the value narrows the peak width. The setting is effective in the full range of masses.
*[Q1 Axis Gain]
Adjusts mass calibration. Higher values shift the peak position of heavier mass toward higher mass.
*[Q1 Axis Offset]
Adjusts mass calibration. Higher values shift the peak position of all masses toward higher mass.
[Q1 Bias]
Controls the speed of ions as they pass through the Q1-pole.
[Q1 Prefilter Bias]
Controls the speed of ions as they pass through the Q1 Prefilter.
[Q1 Postfilter Bias]
Adjusts the velocity of ions that pass through the Q1 Postfilter.
[Q1 Ion Guide] table
Note that the items in this section are related to the hardware settings and these items are usually not displayed. Those items are displayed when [Custom Tune] and [Override Hardware Settings] are selected or [Signal Monitor] and [Show Hardware Settings] are selected on the [Configure Tune Way] dialog box.
You can set the values by entering a value in the text box or with the scroll bar. Click
to
restore the previous value.
[SLS Factor]
For single quad scan or resolution/axis tuning of Q2, Q1 works in the ion guide mode. In the ion guide mode, the Q-pole is operated for a lower resolution.
For the SLS factor, specify the scan line slope for Q1 in the ion guide mode relative to the scan line slope for MS/MS scan (SLS=1).
The [SLS Factor] behaves as shown below in Single Particle Analysis mode with single quad scan.
- The [SLS Factor] item is not displayed in the Tune Modes Pane.
- Only 0 can be set for the [SLS Factor] on the User Tune Pane.
[SLG Factor]
For single quad scan or resolution/axis tuning of Q2, Q1 works in the ion guide mode. In the ion guide mode, the Q-pole is operated for a lower resolution.
For the SLG factor, specify the RF voltage for Q1 in the ion guide mode relative to the RF voltage for MS/MS scan (SLG=1).
[Q2 Ion Guide] table
Note that the items in this section are related to the hardware settings and these items are usually not displayed. Those items are displayed when [Custom Tune] and [Override Hardware Settings] are selected or [Signal Monitor] and [Show Hardware Settings] are selected on the [Configure Tune Way] dialog box.
You can set the values by entering a value in the text box or with the scroll bar. Click
to
restore the previous value.
[SLS Factor]
For resolution/axis tuning of Q1, Q2 works in the ion guide mode. In the ion guide mode, the Q-pole is operated for a lower resolution.
For the SLS factor, specify the scan line slope for Q2 in the ion guide mode relative to the scan line slope for MS/MS scan (SLS=1).
[SLG Factor]
For resolution/axis tuning of Q1, Q2 works in the ion guide mode. In the ion guide mode, the Q-pole is operated for a lower resolution.
For the SLG factor, specify the RF voltage for Q2 in the ion guide mode relative to the RF voltage for MS/MS scan (SLG=1).
[Cell] Table
Click to restore the previous
value saved.
[Use Gas]
If this item is marked, the gas flow adjustment is allowed.
[He Flow]
Adjust the flow rate of helium gas (He) used as the cell gas. The higher the flow rate of He gas, the lower the sensitivity of a sample and the intensity of the background. Adjust the flow rate in order to make the background low enough and to get the necessary level of sensitivity.
[H2 gas]
Adjust the flow rate of hydrogen gas (H2) used as the reaction gas. The higher the flow rate of H2 gas, the lower the sensitivity of a sample and the intensity of the background. Adjust the flow rate in order to make the background low enough and to get the necessary level of sensitivity.
[3rd Gas Flow]
On the Agilent 7700x, if an optional gas line is added other than H2 gas and He gas, another type of gas can be introduced.
On the Agilent 8800, if H2 gas or He gas is added, another type of gas can be introduced.
[4th Gas Flow]
In addition to the He gas, H2 gas, and 3rd Cell Gas, another type of gas can be introduced.
3rd Cell Gas: Helium content of gas mix must be 90% or more; For example: NH3/He mix, He content must be equal to or greater than 90%; Even if introducing a non-corrosive non-flammable gas to the 3rd cell, it still must be diluted with 90% or more Helium.
4th Cell Gas: Use only non-flammable non-corrosive gas.
For important information and precautions on the handling and use of compressed gases (including oxygen, hydrogen and ammonia) refer to the Hardware Maintenance Manual, Ammonia Safety Guide, Hydrogen Safety Guide and Site Preparation Guide.
[OctP Bias]
The potential of the octopole. This is closely related to the value of the energy discrimination. Adjust to get enough sensitivity for all masses. The optimum value in no gas mode is different from that in cell mode.
[Axial Acceleration]
The potential of the Axial Acceleration of the cell. The voltage that is the total of this parameter's setting value and the OctP Bias value is applied to the rear portion of the Oct Pole.
[OctP RF]
Adjust to get enough sensitivity for all masses. An element of low mass gets maximum sensitivity at low voltage. An element of high mass gets maximum sensitivity at high voltage.
[Energy Discrimination]
Difference in potential between the octopole bias and Q-pole bias.
The QP bias is automatically determined from this value. If the energy discrimination is lowered, while the sensitivity increases because the ionic permeation on the Q-pole increases, and the background such as interfering ions also increases.
QP Bias = OctP Bias + Energy Discrimination
[Q-Pole] Table
[Q2] Table
Note that the items in this section are related to the hardware settings and these items are usually not displayed. Those items are displayed when [Custom Tune] and [Override Hardware Settings] are selected or [Signal Monitor] and [Show Hardware Settings] are selected on the [Configure Tune Way] dialog box.
You can set the values by entering a value in the text box or with the
scroll bar. Click to restore
the previous value.
[Mass Gain]
[Q2 Mass Gain]
Adjust the resolution (peak width). As the value is increased, the peak becomes narrower. The effect is larger for higher masses.
[Mass Offset]
[Q2 Mass Offset]
Adjust the resolution (peak width). As the value is increased, the peak becomes narrower. All masses are affected.
[Axis Gain]
[Q2 Axis Gain]
Adjusts mass calibration. Higher values shift the peak position of heavier mass toward higher mass.
[Axis Offset]
[Q2 Axis Offset]
Adjusts mass calibration. Higher values shift the peak position of all masses toward higher mass.
[QP Bias]
[Q2 Bias]
This value is automatically set based on the value of the energy discrimination. Controls the speed of ions as they pass through the Q2-pole.
[Torch Axis] Table
Note that the items in this section are related to the hardware settings and these items are usually not displayed. Those items are displayed when [Custom Tune] and [Override Hardware Settings] are selected or [Signal Monitor] and [Show Hardware Settings] are selected on the [Configure Tune Way] dialog box.
You can set the values by entering a value in the text box or with the
scroll bar. Click to restore
the value saved last time.
[Torch H]
It adjusts the torch position. The Torch-H and Torch-V parameters measure the horizontal and vertical movement of the torch relative to the interface. Adjust to get the highest sensitivity for all masses. When the sampling depth is changed, adjustment of the Torch-H/V will be required. Note: if these parameters are changed using the software scroll bar, the plasma may turn off. Use only the scroll arrows.
[Torch V]
It adjusts the torch position. The Torch-H and Torch-V parameters measure the horizontal and vertical movement of the torch relative to the interface. Adjust to get the highest sensitivity for all masses. When the sampling depth is changed, adjustment of the Torch-H/V will be required. Note: if these parameters are changed using the software scroll bar, the plasma may turn off. Use only the scroll arrows.
[EM] Table
Note that the items in this section are related to the hardware settings and these items are usually not displayed. Those items are displayed when [Custom Tune] and [Override Hardware Settings] are selected or [Signal Monitor] and [Show Hardware Settings] are selected on the [Configure Tune Way] dialog box.
You can set the values by entering a value in the text box or by operating
the scroll bar. Click to restore the previous value.
An electron multiplier (EM) is used as the detector. There are two modes for detecting signals and it is possible to measure samples with concentrations ranging from sub-ppt up to hundreds of ppm. When data acquisition starts, pulse mode at low concentration range and analog mode at high concentration range are automatically switched. When the signal is too high, the mass number is skipped to protect the detector.
[Discriminator]
The discriminator is a threshold for determining the difference between general electrical noise from power supplies etc. and analyte signal. If it is set too low, the noise becomes high. If it is set too high, it cuts not only the noise, but also decreases the sensitivity.
[Analog HV]
Analog mode is selected automatically when the range of the counts are from approximately 1Mcps to the corresponding signal of 4Gcps. If using the normal torch, this mode covers the range from 100 ppb to hundreds of ppm.
[Pulse HV]
Pulse mode is selected automatically when the counts are lower than 1Mcps. If using the normal torch, this mode covers the range from sub ppt to 100 ppb.
[Wait Time Offset] table
The following items are available when [Custom Tune] is selected as the tune method.
You can set the values by entering a value in the text box or by using the scroll bar. Click
to restore
the previous value.
[Wait Time Offset]
Sets the waiting time after the acquisition of the current masses before the next mass acquisition during a scan. Usually set the value to 0 ms. The value may need to be adjusted when an MS/MS acquisition with reaction gas is performed.
Real Time Display Graph
The vertical axis represents the count and the resolution of the horizontal
axis is set to 200 points. When is clicked to start
an acquisition, the signal is displayed. When is clicked,
the display stops.
Usually, the following tabs are not displayed. Those items are displayed when [Custom Tune] and [Override Hardware Settings] are selected or [Signal Monitor] and [Show Hardware Settings] are selected on the [Configure Tune Way] dialog box.
[Sensitivity] Tab
Use this tab to manually tune the sensitivity.
[Resolution/Axis] Tab
Use this tab to manually tune the resolution/axis.
In three graph areas, the spectral peak for each mass is displayed.
Real Time Display Table
The following items are displayed on the real-time display table in the [Sensitivity] tab.
[Ch] column
Displays a channel number.
The channel number is displayed specified in the [Set Acq Parameters for Manual Sensitivity Tune] dialog box, which is displayed when you click
on the tune
toolbar.
[Color] Column
Select the line color used on the graph.
[Display] Column
Set whether to display the count value of each mass on the graph. If this item is checked, the acquired values are displayed in the graph.
[Mass] Column
Displayed when [Single Quad] is selected for [Scan Type].
Displays the masses or intensity ratio during the acquisition.
Select the masses to display on the [Set
Acq Parameters for Manual Sensitivity Tune] dialog box, which is displayed
when you click on the Tune toolbar.
[Q1] column, [Q2] column
Displayed when [MS/MS] is selected for [Scan Type].
These columns display the masses or intensity ratio of Q1 and Q2 under acquisition.
The masses to be displayed can be set on the [Set Acq Parameters for Manual Sensitivity Tune] dialog box displayed by clicking
on
the tune toolbar.
[Range] Column
Sets the range of the Y-axis.
[Count] Column
Displays the latest count values.
[Avg Count] Column
Displays the average of the count values for 200 points that were acquired most recently.
[RSD%] Column
Displays the RSD (coefficient of variation or relative standard deviation) of counts at all acquisition points. The RSD is a value that indicates the degree of dispersion and can be obtained using the following formula:
RSD=(standard deviation/mean) / 100
The [Resolution/Axis] Tab is displayed and the following item is displayed in the [Real Time Display] table on the tab.
[Mass] Row
[Q1] Row, [Q2] Row
When [Q1 Tune] is selected for [MS Tune], the [Q1] row is displayed.
When [Q2 Tune] is selected for [MS Tune], the [Q2] row is displayed.
When [MS/MS Check] is selected for [MS Tune], the [Q1] and [Q2] rows are displayed.
Displays three masses. The masses to be displayed can be set on the
[Set
Acq Parameters for Resolution/Axis] dialog box, which appears when
you click the on the Tune toolbar.
[Display] Row
Set whether to display the count value of each mass on the graph. If this item is marked, the acquired values are displayed in the graph.
[Height] Row
Displays the count of the peak height for each mass.
[Axis] Row
Displays the mass value (mass axis) at the peak position for each mass.
[W-50%] Row
Displays the peak width determined at 50% of the peak height for each mass.
[W-10%] Row
Displays the peak width determined at 10% of the peak height for each mass.
[Integ Time]
Displays the integration time per acquisition point.
[Acq Time]
Displays the total time it will take to acquire data.
To Get Here
- Click [Tune Modes] from the [Acquisition] group in the Task Navigator.