Analyte List pane
This pane is displayed when [FullQuant Analysis] and [Isotope Dilution Analysis], or [Timechart] in the [Analysis mode], are selected from the [Data Analysis Method] table in the Setup Pane.
Analyte List pane (Spectrum)
For isotope dilution analysis, set the analytes and the ISTD elements.
Method Toolbar

 Drag to move the toolbar.
 Displays
the settings for the previous basic method task.
Displays
the settings for the previous basic method task.
 Displays the settings for the next
basic method task.
Displays the settings for the next
basic method task.
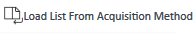 Opens the [Select
a Batch Folder for Analyte List] dialog box, which lets you select
the Method file to load the Analyte List from. For data acquired with
Multi Tune, a dialog box is displayed that lets you select the Tune Mode
to load.
Opens the [Select
a Batch Folder for Analyte List] dialog box, which lets you select
the Method file to load the Analyte List from. For data acquired with
Multi Tune, a dialog box is displayed that lets you select the Tune Mode
to load.
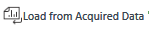 Opens
the [Select
a Data File for Analyte List] dialog box, which lets you select the
data file to load the Analyte List from. For data acquired with Multi
Tune, a dialog box is displayed that lets you select the Tune Mode to
load.
Opens
the [Select
a Data File for Analyte List] dialog box, which lets you select the
data file to load the Analyte List from. For data acquired with Multi
Tune, a dialog box is displayed that lets you select the Tune Mode to
load.
 Adds
a new analyte. The analyte is added to the end row of the table.
Adds
a new analyte. The analyte is added to the end row of the table.
 Deletes the selected element.
Context Menu
This section describes the commands that are available in the context menu that is displayed when you right-click in the pane. The commands that are not listed below have the same function as their counterparts on the toolbars and the Ribbon.
[Export Table]
Opens the [Export Table] (Entire Table) dialog box where you can export the entire table. This command is available when a pane that includes a table is selected.
[Export Selected Area]
Opens the [Export Table] (Area) dialog box where you can export the data selected in the table. This command is available when a range of cells in the table is selected.
[Copy]
Copies the selected data to the Clipboard. When a tabular pane is selected, the selected row/column is copied.
[Paste]
Pastes the data copied with the Copy command.
[Reset Sort]
Restores the default sorting order on a tabular pane.
[Fill Down]
When this command is executed after you select multiple cells vertically, the value in the first cell is copied to the selected cells.
[Fill Across]
When this command is executed after you select multiple cells horizontally, the value in the first cell is copied to the selected cells.
[Page Setup]
Opens the [Page Setup] dialog box where you can configure the page settings for printing.
[Print]
Opens the [Print] dialog box where you can print the contents of the selected pane.
[Print Preview]
Opens the [Print Preview] dialog box where you can display the print preview.
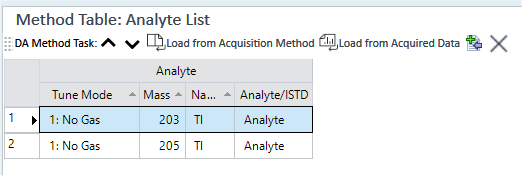
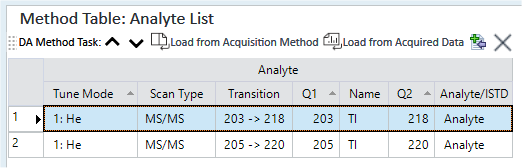
Analyte Table
Tune Mode
Lets you select the Tune Mode from the list.
Mass
Enter the mass.
Scan Type
Lets you select a scan type.
Transition
Displays the transition of masses when [Scan Type] is [MS/MS].
Q1
Lets you select the masses of Q1 when [Scan Type] is [MS/MS].
Name
Enter the element name.
Q2
Lets you select the masses of Q2.
Analyte/ISTD
Lets you select Analyte or ISTD from the list.
To Get Here
- Click [Analyte List] from the [Set up Analyte] group in the Method Development Tasks pane.
- Click [Analyte List] from the [Acquisition] group in the Task Navigator.
Analyte List Pane (Timechart)
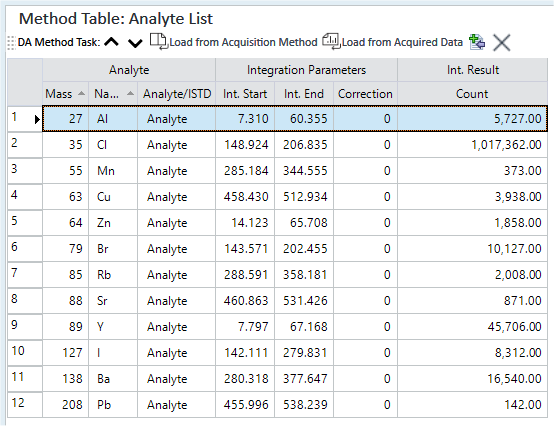
Sets the analytes, ISTD elements, and integration parameters when the Analysis Mode is set to “Timechart” in the Data Analysis Method table. The Timechart pane is also displayed.
Method Toolbar
Drag to move the toolbar.
Displays
the settings for the previous basic method task.
Displays the settings for the next
basic method task.
Opens the [Select
a Batch Folder for Analyte List] dialog box, which lets you select
the Method file to load the Analyte List from.
Opens
the [Select
a Data File for Analyte List] dialog box, which lets you select the
data file to load the Analyte List from.
Adds
a new analyte to the end row of the table.
Deletes the selected element.
Context Menu
This section describes the commands that are available in the context menu that is displayed when you right-click in the pane. The commands that are not listed below have the same function as their counterparts on the toolbars and the Ribbon.
[Export Table]
Opens the [Export Table] (Entire Table) dialog box where you can export the entire table. This command is available when a pane that includes a table is selected.
[Export Selected Area]
Opens the [Export Table] (Area) dialog box where you can export the data selected in the table. This command is available when a range of cells in the table is selected.
[Copy]
Copies the selected data to the Clipboard. When a tabular pane is selected, the selected row/column is copied.
[Paste]
Pastes the data copied with the Copy command.
[Reset Sort]
Restores the default sorting order on a tabular pane.
[Fill Down]
When this command is executed after you select multiple cells vertically, the value in the first cell is copied to the selected cells.
[Fill Across]
When this command is executed after you select multiple cells horizontally, the value in the first cell is copied to the selected cells.
[Page Setup]
Opens the [Page Setup] dialog box where you can configure the page settings for printing.
[Print]
Opens the [Print] dialog box where you can print the contents of the selected pane.
[Print Preview]
Opens the [Print Preview] dialog box where you can display the print preview.
Analyte Table
Mass
Enter the mass.
Scan Type
Lets you select a scan type.
Transition
Displays the transition of masses when [Scan Type] is [MS/MS].
Q1
Lets you set the masses of Q1 when [Scan Type] is [MS/MS].
Name
Enter the element name.
Q2
Lets you set the masses of Q2.
Analyte/ISTD
Select Analyte or ISTD from the list.
Int. Start
Enter the time point to start integration, in seconds.
Int. End
Enter the time point to stop integration, in seconds.
Correction
For baseline correction, double-click the column and enter the correction points.
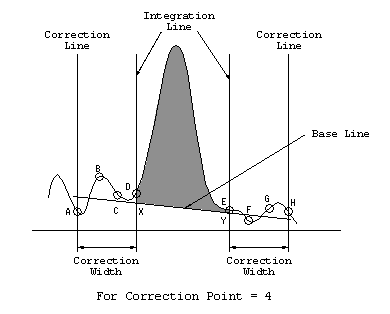
If the baseline slopes, you can select different points to change the integration window. The points relate to the number of time slices on either side of the window that the baseline is measured. The mean point between the sides of the original window and the outer window is fixed as the baseline correction. For a point X (size is the average of A, B, C, and D; horizontal position is at D) and a point Y (size is the average of E, F, G, and H; horizontal position is at E), the line XY is used as the baseline.
Count
Displays the integration result in counts.
To Get Here
- Click [Analyte List] from the [Set up Analyte] group in the Method Development Tasks pane.
- Click [Analyte List] from the [Acquisition] group in the Task Navigator.