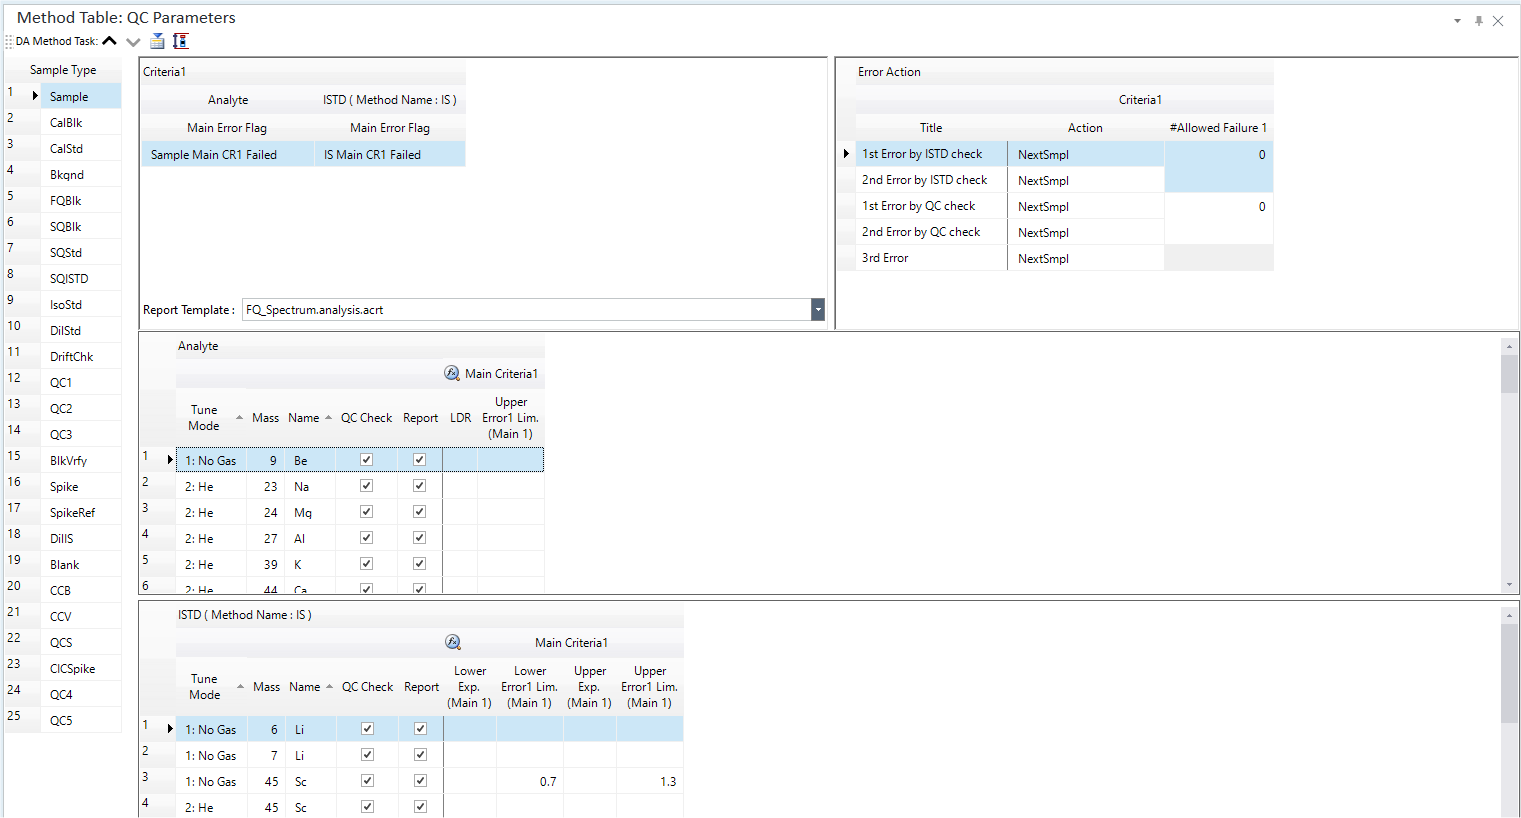
QC Parameters pane
Sets the analysis parameters when Intelligent Sequence (Option) is selected in the Data Analysis Method table.
- Method Toolbar
- Context Menu
- Sample Type Table
- Report Template Table
- Error Action Table
- Analyte Table
- ISTD Table
- To Get Here
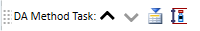
Method Toolbar
 Drag to move the toolbar.
 Moves
to the previous basic method task settings.
Moves
to the previous basic method task settings.
![]() Opens the [Open
QC Sample] dialog box for loading a QC sample.
Opens the [Open
QC Sample] dialog box for loading a QC sample.
![]() [QC
Configuration] window for setting a Sample Type.
[QC
Configuration] window for setting a Sample Type.
Context Menu
This section explains the commands available in the context menu that is displayed by right-clicking in the pane. The commands that are not listed below have the same function as their counterparts on the toolbars and the Ribbon.
[Set QC Check Flag to All QC Samples]
This command can be executed on QC Check column of QC Parameters panes which is displayed when Intelligent Sequence Software is used. When this command is executed, all the QC Check columns of QC Samples will be checked.
[Set Report Flag to All QC Samples]
This command can be executed on Report column of QC Parameters panes which is displayed when Intelligent Sequence Software is used. When this command is executed, all the QC Report columns of QC Samples will be checked.
[Export Table]
Opens the [Export Table] (Entire Table) dialog box where you can export the entire table. This command is available when a pane that includes a table is selected.
[Export Selected Area]
Opens the [Export Table] (Area) dialog box where you can export the data selected in the table. This command is available when a range of cells in the table is selected.
[Copy]
Copies the selected data to the Clipboard. When a tabular pane is selected, the selected row/column is copied.
[Paste]
Pastes the data copied with the Copy command.
[Reset Sort]
Restores the default sorting order on a tabular pane.
[Fill Down]
When this command is executed after selecting multiple cells vertically, all selected cells will be filled with the value in the first cell.
[Page Setup]
Opens the [Page Setup] dialog box where you can configure the page settings for printing.
[Print]
Opens the [Print] dialog box where you can print the contents of the selected pane.
[Print Preview]
Opens the [Print Preview] dialog box where you can display the print preview.
Sample Type Table
Sample Type
Select the Sample Type. The QC parameters for the selected Sample Type are displayed in the panes.
- Sample
- CalBlk
- CalStd
- Bkgnd
- FQBlk
- SQBlk
- SQStd
- SQISTD
- IsoStd
- DilIS
- DilStd
- DriftChk
- QC1
- QC2
- QC3
- QC4
- QC5
- BlkVrfy
In addition, the sample type and QC items set by the user in the QC configuration will be displayed.
Report Template Table
Select the QC report template from the list. The QC report is generated for the elements that are marked in the Report column of the Analyte Table.
If the sample type is set with criteria, an error flag table will be displayed.
If you wish to include error occurrences in the QC report, enter the string to output to the QC report in the text box. Usually, the words “Error” or “Fail” are entered. Errors are not output to the QC report if this box is left blank.
Error Action Table
Sets the actions for when a failure occurs. This table sets the error actions taken when a QC error occurs for the QC elements and/or ISTD elements. Each QC type may have its own internal standard Error Action, set independently of other QC types.
The terms "AOF", "Action on Failure", and "Action Failure" have been changed to "Error Action" in MassHunter 4.4.
The most recent CalBlk value in the sequence will always be used as the internal standard value.
Should an ISTD failure and a QC failure both occur for a single sample, the error actions for the ISTD failure will take precedence.
Title
Displays the error action items.
- 1st Error by ISTD check
- 2nd Error by ISTD check
- 1st Error by QC check
- 2nd Error by QC check
- 3rd Error
Action
Select the actions for when a failure occurs.
- NextSmpl:
Analyze the next sample
- Abort:
Stop the sequence
- Blk(Abort) – NextSmpl:
Analyze the next sample after analyzing a [BLANK] block. (Stop the sequence if the blank fails.)
- Blk(Count) – NextSmpl:
Analyze the next sample after analyzing a [BLANK] block. (Continue the sequence even if the blank fails.)
- Blk(Abort) – SameSmpl:
Analyze the same sample after analyzing a [BLANK] block. (Stop the sequence if the blank fails.)
- Blk(Count) – SameSmpl:
Analyze the same sample after analyzing a [BLANK] block. (Continue the sequence even if the blank fails.)
- Cal - SameSmpl:
Analyze the same sample after regenerating [CALIB].
- Cal - AllSmpls:
Analyze all samples beyond the last passing [CCV] block, after regenerating [CALIB].
- NextLot
Analyze the samples for the next lot.
- Run User Script:
Opens the [Select Script File] dialog box, which allows you to select the path for the script file.
However, this cannot be set for database integration that uses Protect Local Data mode.
AVS Dilute*5-SameSmpl
Measures the sample's 5X dilution. However, new data acquisition is not possible.
AVS Dilute*10-SameSmpl
Measures the sample's 10X dilution. However, new data acquisition is not possible.
AVS Dilute*20-SameSmpl
Measures the sample's 5X dilution. However, new data acquisition is not possible.
- SameSmple:
Simply re-analyze the same sample.
- Reslope - NextSmple:
Analyze the next sample after regenerating a calibration curve on a single DCS data. For the Y-intercept, multiply the previous calibration curve with the change in the coefficient of sensitivity. The curve is created again only when the calibration curve is a linear expression. This error action can be set for DriftChk samples only.
- Dilute and Re-Run
This is available when using prepFAST as an autosampler or ADS 2 as a sample introduction.
If a sample analysis fails, the sample is diluted and analyzed again. If the sample is reanalyzed twice and the third analysis fails, the next sample is analyzed.
#Allowed Failure
Enter the number of elements allowed to be failed. When 0 is entered, if even one element fails, the action is taken.
Analyte Table
Sets the analytes for QC check and QC report generation.
Tune Mode
Displays the Tune Mode.
Mass
Displays the mass.
Name
Displays the element name.
QC Check
Mark the checkboxes for analytes to be included in the QC check; to exclude analytes, clear the check.
If an analyte is selected for a QC Check, graphs are displayed in the QC Sample Stability Graph pane of the [ICP-MSICP-QQQ Data Analysis] window to indicate the stability of the quantitative results. For details on viewing and operating the pane, refer to “QC Sample Stability Graph Pane Operation”.
By right-clicking the QC Check column and selecting [Set QC Check Flag to All QC Samples] from the context menu, you can select all checkboxes.
Report
Mark the checkboxes for the analytes to be included in the QC report; to exclude analytes, clear the check.
By right-clicking the QC Check column and selecting [Set Report Flag to All QC Samples] from the context menu, you can select all checkboxes.
Criteria
Displays the settings for the QC parameter criteria. The items and settings displayed depend on the selected sample type. The settings can be edited.
ISTD Table
Sets the ISTD elements for QC check and QC report generation.
Tune Mode
Displays the Tune Mode.
Mass
Displays the mass.
Name
Displays the element name.
QC Check
Mark the checkboxes for the ISTD elements to be included in the QC check; for elements that are to be excluded, clear the check.
If an ISTD element is selected for a QC Check, graphs are displayed in the QC Sample Stability Graph pane of the [ICP-MSICP-QQQ Data Analysis] window to indicate the stability of the quantitative results. For details on viewing and operating the pane, refer to “QC Sample Stability Graph Pane Operation”.
By right-clicking the QC Check column and selecting [Set QC Check Flag to All QC Samples] from the context menu, you can select all checkboxes.
Report
Mark the checkboxes for the ISTD elements to be included in the QC report; for analytes that are to be excluded, clear the check.
By right-clicking the QC Check column and selecting [Set Report Flag to All QC Samples] from the context menu, you can select all checkboxes.
To Get Here
- When [FullQuant Analysis] and [Intelligent Sequence] are set to On in the [Data Analysis Method] table, click [QC Setup] from the [Advanced Info] group in the Method Development Tasks pane.
- When [FullQuant Analysis] and [Intelligent Sequence] are set to On in the [Data Analysis Method] table in the Setup Pane , click [QC] from the [Acquisition] group in the Task Navigator.